Performance Measurement Glossary: Key Terms
Definition of North Star metric
What is a North Star metric?
A North Star metric is the single measure that best captures the core value a product delivers to customers. It serves as the ultimate success indicator; when it improves, both user satisfaction and business performance advance together.
Unlike vanity metrics that look impressive but don't reflect true product health, a North Star metric measures what actually matters. In practice, successful companies define their North Star as a behavior that directly reflects value.
The fundamental characteristic is dual alignment: the metric must simultaneously reflect genuine user value and predict business outcomes. When users engage more deeply with core product features, revenue, retention, and growth naturally follow. This makes the North Star metric the organizing principle for prioritization, strategic decisions, and long-term planning across product and engineering teams.
What is the difference between the North Star metric and KPI?
The distinction centers on scope, purpose, and organizational function:
- Scope: A North Star metric is singular, one measure of ultimate product success. KPIs are plural: multiple operational metrics tracking specific aspects of performance.
- Purpose: The North Star metric measures fundamental value delivery. KPIs measure operational efficiency and execution quality.
- Time horizon: North Star metrics emphasize long-term sustainable growth over months and years. KPIs track short-term performance, enabling immediate course correction.
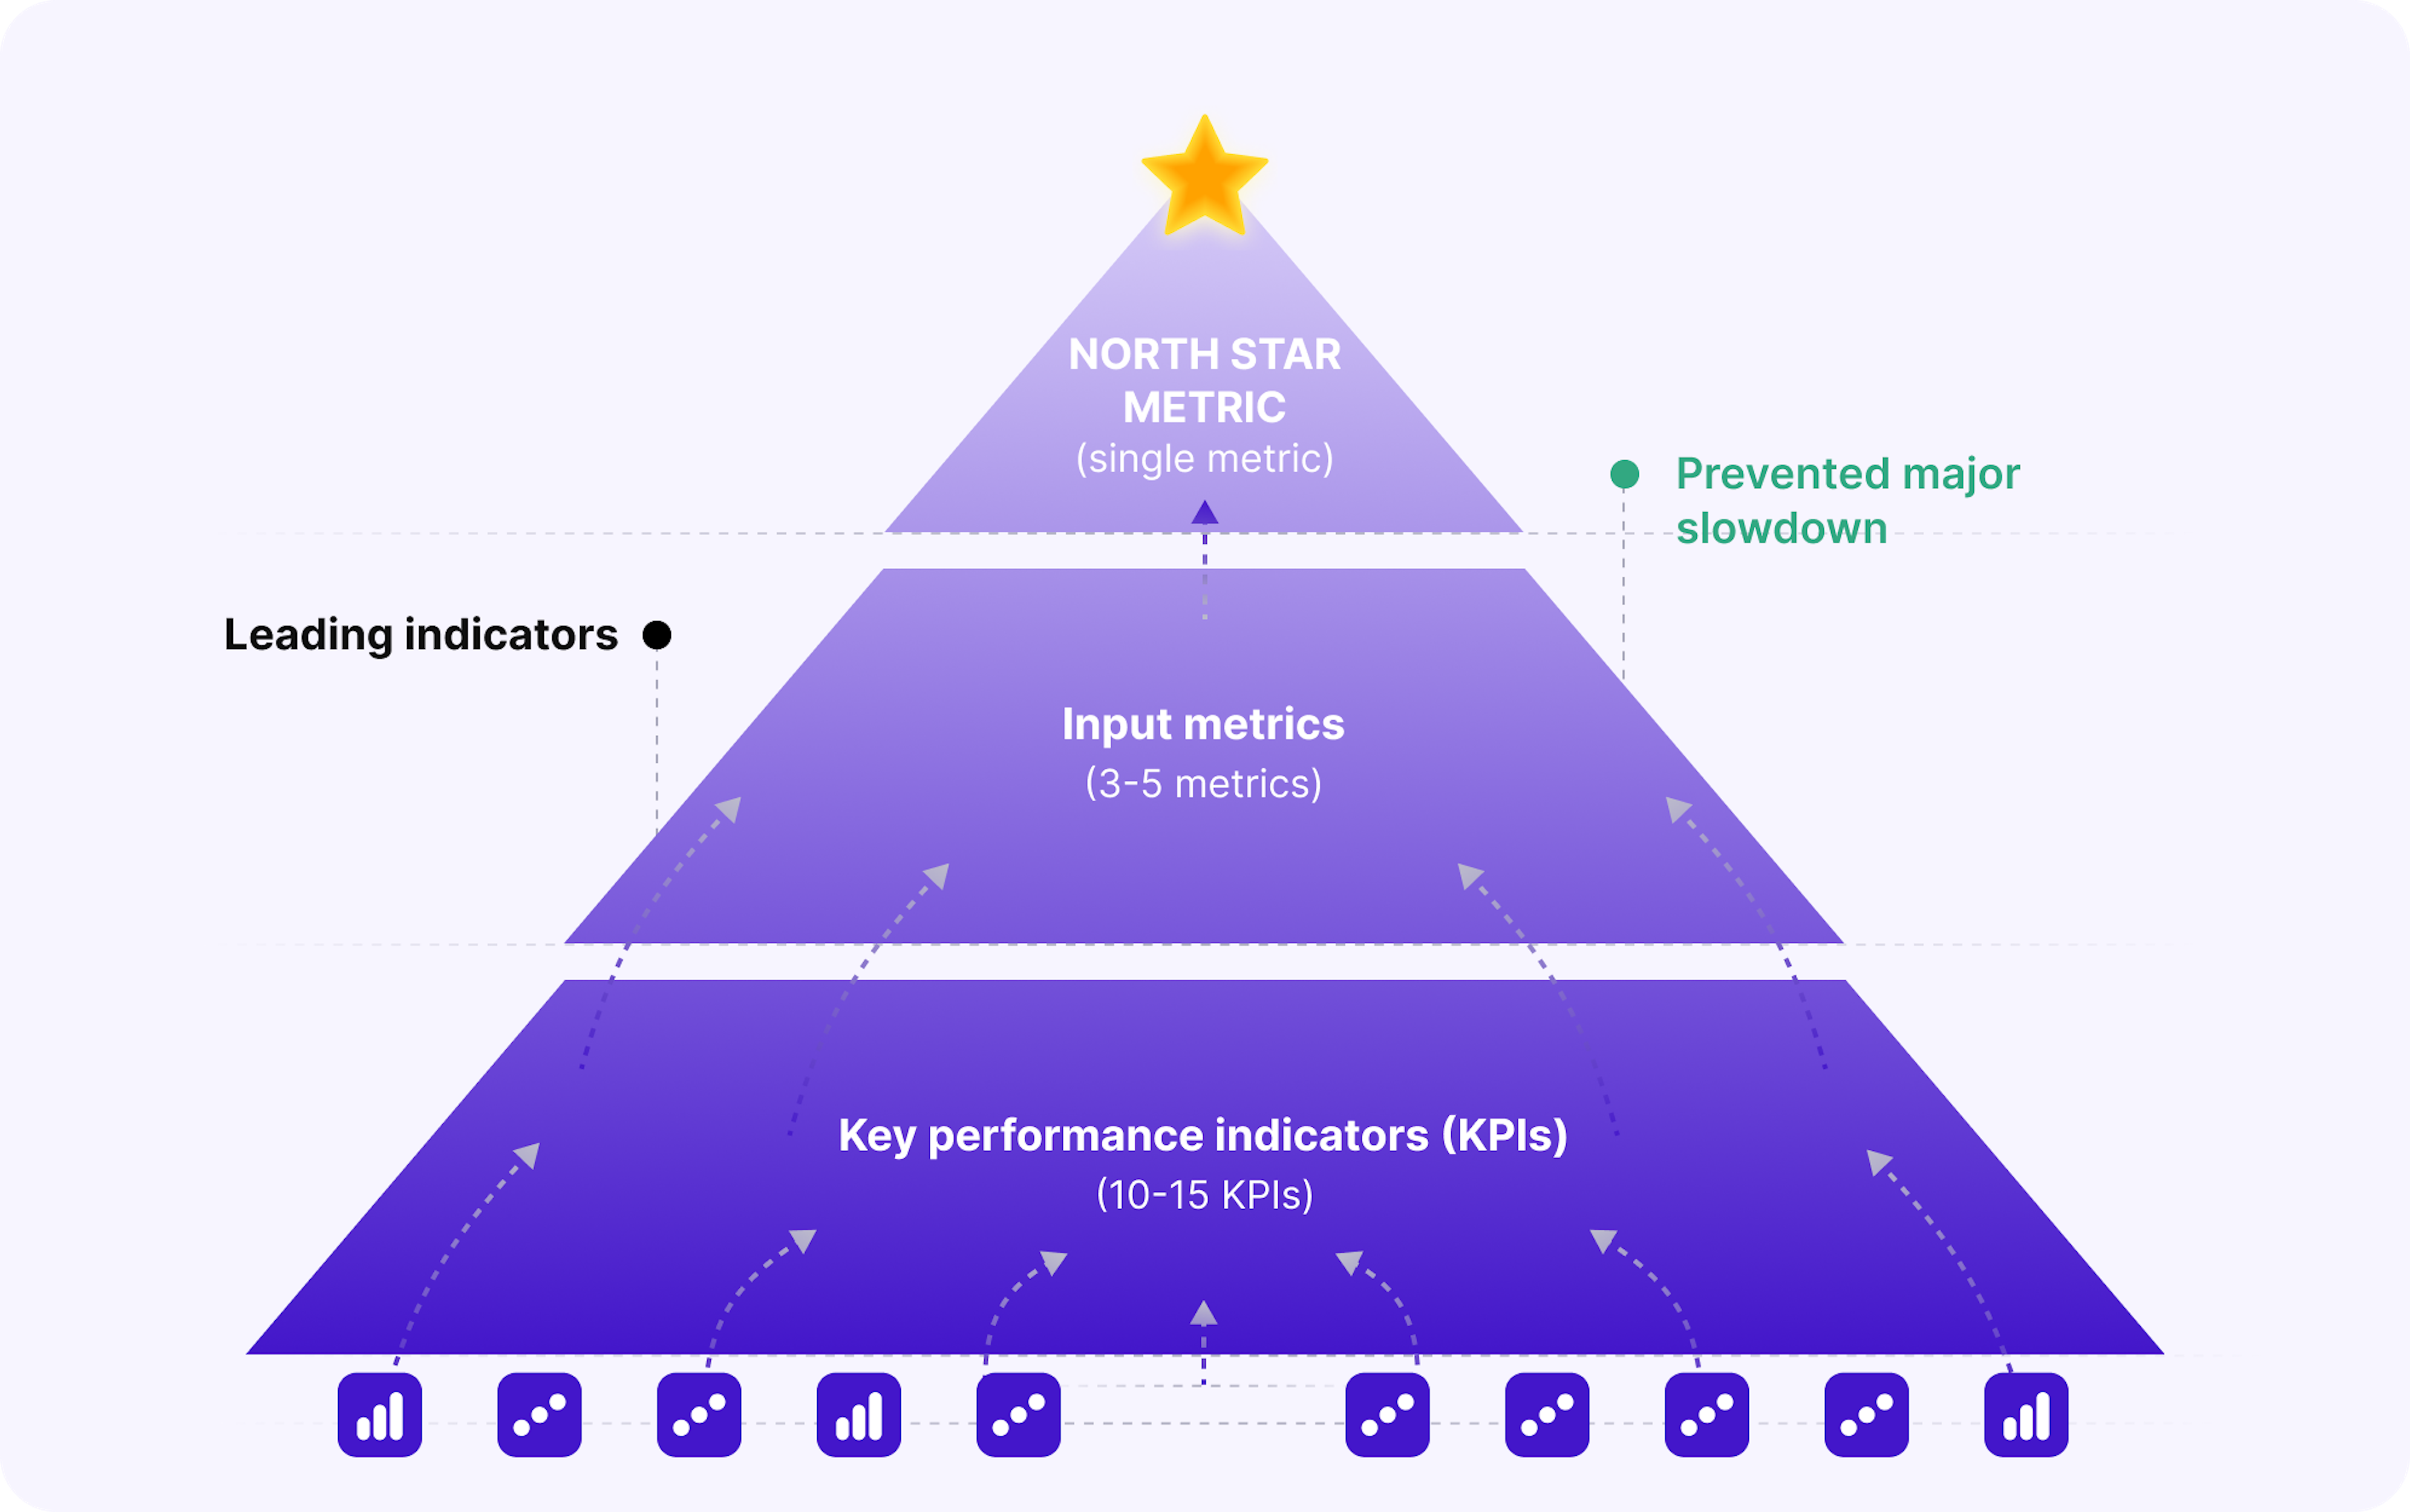
- Strategic vs. operational: The North Star metric sits at the top. KPIs are supporting metrics that, when improved, should contribute to North Star growth.
- Hierarchy: The North Star, relevant KPIs include feature adoption rate, onboarding time, and bug resolution speed, each contributing to sustained engagement.
Both are essential. The North Star metric prevents teams from optimizing the wrong things, while KPIs enable the operational excellence needed to move the North Star metric upward.
Why is a North Star metric important for product and engineering teams?
Why is a North Star metric important for product and engineering teams?
A North Star metric transforms how teams prioritize work, make decisions, and measure success by creating a unified focus. Here’s how it acts:
- Creates cross-functional alignment: Product and engineering teams often optimize different metrics. A North Star metric aligns with shared success criteria. When all teams optimize for the same outcome, like active users, completed transactions, and time in product, feature debates resolve faster with objective evaluation criteria.
- Prevents local optimization: Without a unified focus, teams optimize KPIs independently, creating suboptimal outcomes. Engineering might prioritize deployment speed while product prioritizes feature quantity, neither directly improving user value. A single guiding metric ensures system-level optimization.
- Enables faster decision-making: Strategic choices become clearer when measured against one success criterion. Should engineering invest in performance optimization or new features? The answer: whichever moves the metric more.
- Maintains long-term focus: KPIs fluctuate weekly; the North Star trends over quarters. This longer horizon prevents chasing short-term wins that sacrifice sustainable growth, helping teams resist pressure to ship low-quality features quickly.
- Simplifies stakeholder communication: Executives don't need to understand 20 engineering KPIs. One clear, non-technical measure provides insight into product health, enabling strategic resource allocation without requiring deep operational knowledge.
Studies on product‑led growth and North Star metrics show that teams that align around a clear value metric tend to ship fewer, more focused features while achieving significantly better user retention, because they prioritize sustained customer value over sheer feature volume.
How do you define a North Star metric?
Defining a North Star metric requires systematic analysis connecting customer value to business outcomes.
Step 1: Identify core product value
Start with: "What value does our product deliver that makes customers' lives meaningfully better?" This isn't what your product does; it's the outcome it enables. Slack doesn't deliver "messaging," but rather "team coordination." Document the specific problem your product solves and the transformation it creates.
Step 2: Map value to measurable behavior
Translate the core value into observable actions users take when receiving that value. If your product delivers "effective project management," users demonstrate value through updating tasks, reviewing dashboards, coordinating with teams, and completing projects. List 5-10 behaviors indicating value delivery.
Step 3: Evaluate candidates against criteria
For each candidate metric check:
- Value linkage: Does the metric increase when customers receive more value?
- Business impact: Does growth correlate with revenue, retention, and sustainability?
- Quality and robustness: Can the metric be gamed, or does it require genuine improvement?
- Clarity: Can non-technical stakeholders grasp what it means?
- Actionability: Can teams directly influence it through their work?
Step 4: Validate correlation with business outcomes
Analyze historical data confirming your chosen metric predicts business success. Calculate correlations between candidates and revenue, retention, and expansion over 6-12 months. The metric with the strongest correlation to multiple business outcomes is typically your North Star metric.
Step 5: Define supporting input metrics
Identify 3-5 metrics that directly contribute to your North Star metric. If "weekly active projects" is your North Star, inputs might include new project creation rate, team invitation rate, feature usage breadth, and onboarding completion rate.
Step 6: Establish baseline and targets
Measure current performance and set realistic improvement targets using historical growth rates, industry benchmarks, and business goals. This systematic approach typically takes 2-4 weeks but creates clarity that accelerates decision-making for years.
This systematic approach creates clarity that accelerates decision-making for years. A common challenge: most North Star metric examples focus on consumer apps; monthly active users, content created, transactions completed. What should engineering and developer-focused teams measure instead?
What are good North Star metric examples for engineering teams?
Engineering-focused products require North Star metrics reflecting both technical excellence and user value delivery.
- Developer tools: Weekly active developers using the platform (GitHub), successful deployments per week (CI/CD platforms), API calls from production applications (Stripe, Twilio)
- Project management: Weekly active projects with 3+ contributors (Jira, Asana), projects completed per month, cross-team collaborations initiated (Slack)
- Infrastructure tools: Incidents detected and resolved through the platform (Datadog), infrastructure managed under the platform (AWS), and mean time to detection improvement
- Code quality tools: Pull requests reviewed with platform assistance, code quality issues prevented in pre-production, and developer time saved per week
- Engineering analytics: Weekly teams making data-driven decisions, projects with improved delivery predictability, and executive stakeholders regularly accessing insights
The best North Star metrics balance technical metrics reflecting platform capability with outcome metrics showing business impact. Avoid purely technical metrics like "code commits" that don't reflect value delivery.
How does Enji help define, track, and connect your North Star metric to day-to-day KPIs?
Enji transforms North Star metric management from manual guesswork into a data-driven strategy through automated tracking, intelligent analysis, and clear connections between high-level goals and operational execution.
| CHALLENGE | FEATURE | IMPACT |
|---|---|---|
| Metric selection | PM Agent analyzes historical data to surface correlations: "Projects with daily team engagement show 85% on-time delivery" | Choose North Star metrics backed by data, not assumptions |
| Manual tracking | Team Code Metrics + Project Margins automatically calculate candidates – weekly active projects, collaboration frequency, completion rates – from connected tools | Real-time North Star visibility without manual tracking |
| Unclear connections | Team Code Metrics maps which KPIs drive North Star movement: feature adoption, capacity utilization, cycle time, quality | Focus effort on KPIs that actually move the North Star |
| Missing leading indicators | Summarizer surfaces patterns: "Projects completing onboarding within 48 hours show 3x higher monthly activity" | Prioritize input metrics with maximum North Star impact |
| Unknown intervention effectiveness | Project Narrative™ technology correlates actions with outcomes: reduced deployment time → 15% increase in weekly active projects | Validate what works vs. what wastes resources |
| Technical translation gap | PM Agent links North Star changes to revenue impact in stakeholder-ready reports | Make engineering work's strategic impact visible to leadership |
Key Takeaways
- A North Star metric is the single measure capturing core product value – the organizing principle that aligns product and engineering teams around shared success.
- Unlike KPIs, which are plural and operational, a North Star metric is singular and strategic, with KPIs serving as supporting inputs that drive its movement.
- A clear North Star metric prevents local optimization, accelerates decisions, sustains long-term focus, and reduces product health to one number stakeholders can act on.
- Strong North Star metrics for engineering teams balance technical capability with business impact – such as weekly active developers, successful deployments per week, or teams making data-driven decisions.
- Defining one means identifying core product value, mapping it to measurable behavior, validating correlation with business outcomes, and selecting 3–5 supporting input metrics.
- Enji supports North Star metric management through correlation analysis, automated tracking, KPI mapping, and summaries that translate engineering performance into business impact.

Last updated in January 2026