Performance Measurement Glossary: Key Terms
Definition of Leading indicator
What is a leading indicator?
A leading indicator is a measurable signal that forecasts future performance, highlighting potential problems or opportunities before they materialize in project outcomes. This helps teams intervene proactively before issues impact outcomes.
In software project management, leading indicators detect patterns that predict schedule delays, quality issues, or resource constraints weeks before they manifest. Rising code review backlog signals future velocity problems; increasing work-in-progress warns of upcoming bottlenecks; growing technical debt forecasts quality degradation.
The value lies in the 2–4 weeks of advance warning these metrics provide. When code review participation drops 30%, managers can reallocate reviewers before velocity collapses. This forward-looking visibility transforms project management from reactive firefighting into proactive risk mitigation.
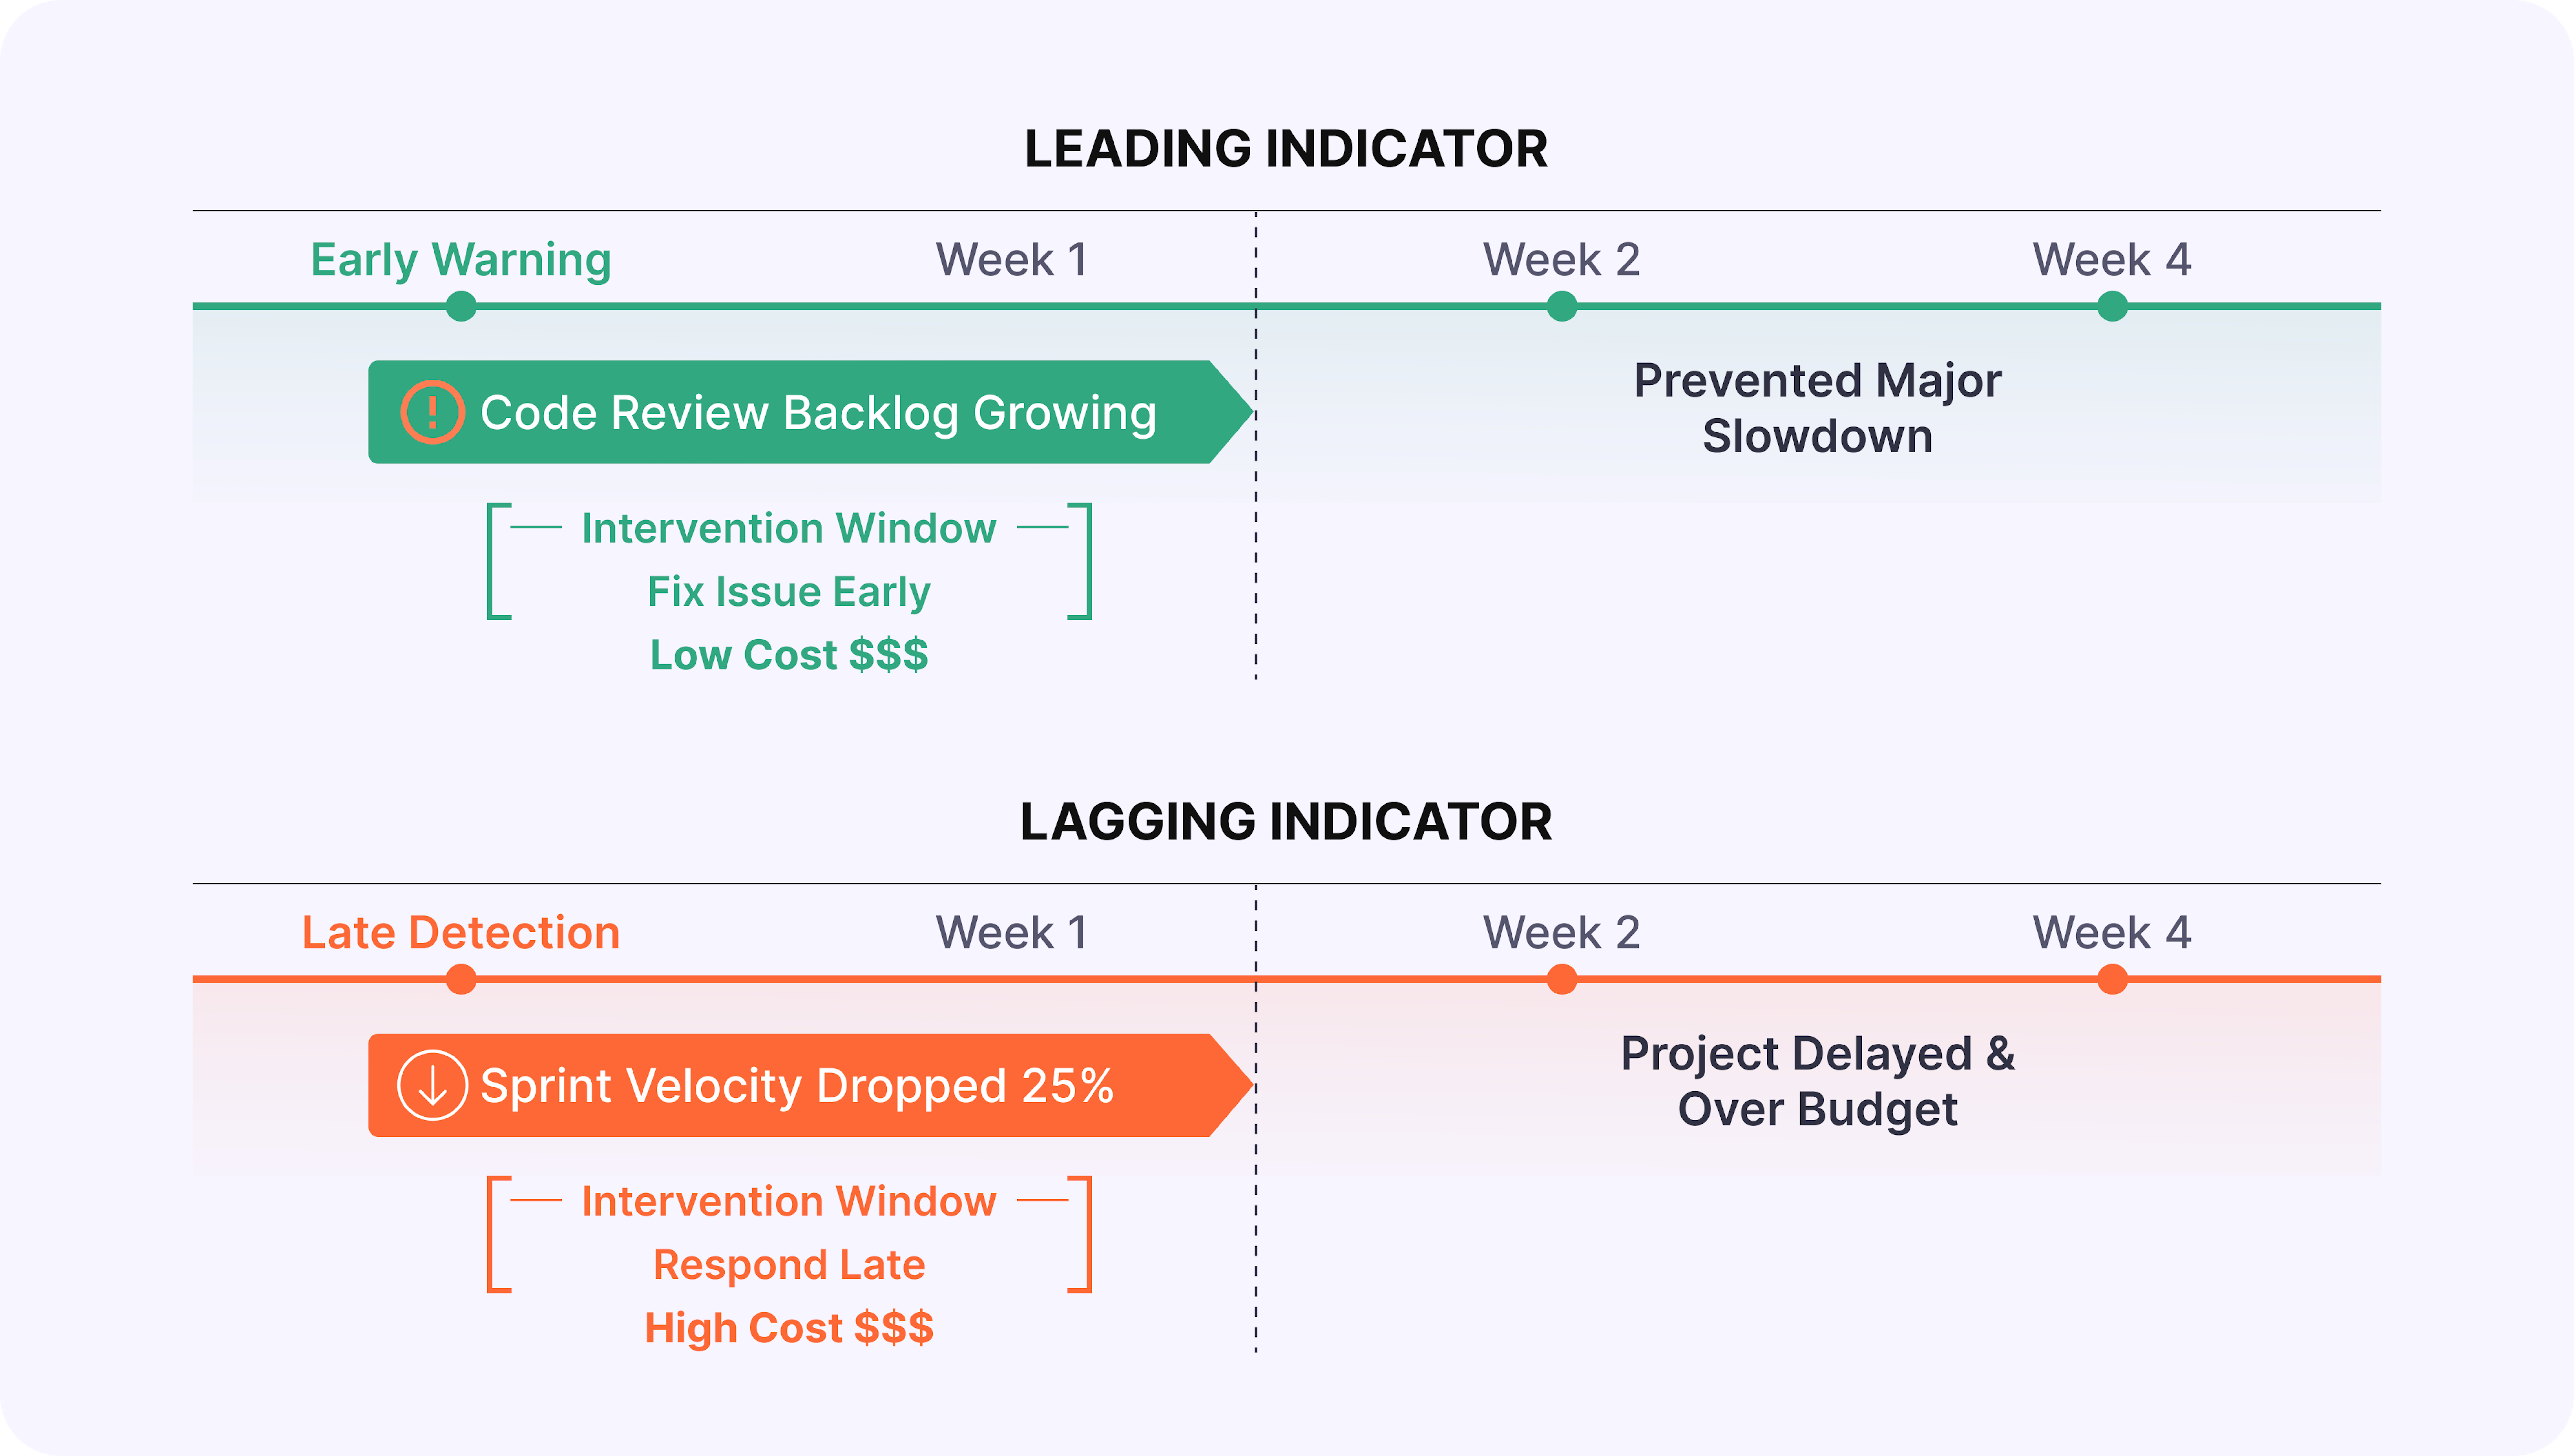
How is a leading indicator different from a lagging indicator?
Leading and lagging indicators describe different kinds of signals about project health. Understanding how they differ helps leaders choose the right metrics for both early warning and accountability:
- As mentioned earlier, leading indicators predict future outcomes by measuring activities that drive performance, but their real value is in being actionable: teams can intervene before problems fully develop. For example, a jump in work‑in‑progress from 12 to 18 tasks often warns a team of upcoming bottlenecks before throughput drops.
- Unlike leading indicators, which highlight risks early, lagging indicators measure outcomes that have already occurred, confirming success or failure after the fact. These indicators are essential for accountability, but they don't enable prevention because the damage is already done. For example, a sprint that misses its deadline by three days reveals a delivery problem only once customer impact is unavoidable.
Bringing the two together is where real value emerges. Leading indicators guide real‑time decisions, while lagging indicators validate whether interventions worked. Teams that track only lagging metrics discover problems after options narrow and costs rise, whereas those that actively monitor leading signals can adjust course early enough to protect timelines, quality, and budget.
Why are leading indicators important?
Leading indicators matter because they change when teams see problems and which options they still have to respond. Instead of discovering issues only after deadlines slip or customers are impacted, teams get a time window where solutions are simpler, cheaper, and less disruptive.
- Lower cost of fixing problems
Catching issues early is dramatically cheaper than resolving them once they affect production, customers, or budgets. A code review backlog highlighted three weeks in advance can be handled by reallocating reviewers, whereas the same signal ignored becomes a release delay that requires overtime, emergency hires, or painful de‑scoping. - Preserved strategic and delivery options
Early signals keep more responses on the table. If technical debt trends point to quality issues four weeks out, teams can refactor gradually, strengthen tests, or trim scope. If the first signal is a spike in production incidents, remaining options are far more disruptive: freezing feature work, rushing hotfixes, or shipping with known risks. - Protection of team health and sustainability
Leading indicators expose unsustainable load before burnout hits. Capacity overload, rising overtime, or growing unplanned work show up as early signals that workload is exceeding healthy limits. Managers can rebalance work or renegotiate timelines before productivity drops, morale erodes, and attrition risk increases. - Stronger trust and clearer communication with stakeholders
Early, quantified signals make conversations with executives and customers more credible. Instead of reporting after the fact, "We missed the deadline," teams can say, "We're trending 10% over capacity; we recommend de‑scoping Feature X or extending the timeline by two weeks." This kind of forward‑looking transparency builds trust and positions the team as a reliable partner.
Teams that systematically track leading indicators benefit on all four fronts at once: they spend less on late fixes, retain more strategic flexibility, protect their people, and communicate with stakeholders from a position of informed control rather than damage control.
What are common examples of leading indicators for software teams?
Software teams track leading indicators to stay ahead of delivery risks, quality issues, capacity overload, and process breakdowns. In practice, these early signals fall into four key categories that engineering leaders watch every day:
Delivery and velocity predictors
- Work-in-progress trends: When a team takes on 15 tasks, but historical data shows 10 as sustainable, velocity typically drops 2–3 weeks later.
- Cycle time variance: Inconsistent task completion times signal process instability that leads to missed deadlines.
- Pull request aging: PRs sitting unreviewed for 3+ days predict integration delays down the line.
Quality and technical health indicators
- Code review thoroughness declining: Fewer review comments per PR or rushed reviews on large changes predict quality escapes 1–2 sprints later.
- Technical debt accumulation: Debt growing 15% monthly while feature velocity stays constant serves as a CPI leading indicator, with defect rates spiking 8–12 weeks later.
- Test coverage trending downward: This forecasts production incidents 4–6 weeks out.
Team collaboration and capacity signals
- Communication frequency dropping 30%: Predicts coordination failures 2–3 weeks later.
- Overtime hours trending upward: Signals burnout risk 4–8 weeks ahead.
- Unplanned work percentage rising: When firefighting jumps from 20% to 40% of capacity, sprint goals become unreachable before failures occur.
Process and financial indicators
- Blocked tasks stuck 3+ days: Predict workflow breakdowns.
- Rework rate increasing: Forecasts quality crises 2–4 weeks ahead.
- Scope creep mid-sprint: Unplanned story points added predict budget overruns 4–6 weeks before financial impact appears.
- Vendor response time degrading: Signals integration delays before they block critical paths.
Effective teams monitor 8–12 specific leading indicators spread across these four categories, each one aligned with their highest‑impact risks.
How do you choose effective leading indicators for your projects?
Selecting the right leading indicators requires focusing on your highest risks while ensuring they're predictive, actionable, and measurable. Here is a step‑by‑step approach you can use to choose and refine them:
Step 1. Start with the highest-impact risks
Identify your project's 3–5 most critical risks and success factors. Match indicators directly to these priorities. For a Q3 launch risk, track sprint velocity trends and blocked task age. For quality concerns, monitor code review depth and test coverage.
Step 2. Ensure indicators are predictive and actionable
Validate through historical data: when the indicator changed, did the predicted outcome follow 2–4 weeks later? Only track signals where intervention is possible. "Growing code review backlog" lets you reallocate reviewers. External factors like "market conditions shifting" are not actionable.
Step 3. Confirm measurability and balance
Indicators must pull from existing systems automatically: no manual logging. Aim for 60% leading indicators (early warnings) and 40% lagging (outcome validation) to maintain balance without overwhelming teams.
Step 4. Keep it manageable
Monitor 8–12 indicators maximum. Test hypotheses for 2–3 months: Did they provide advance warning? Were interventions effective? Drop indicators that don't add value.
Teams that align indicators to specific risks, validate their predictive power, and continuously refine their set build early warning systems that prevent most project crises. With the right indicators selected, Enji makes tracking and acting on them straightforward and automatic.
How does Enji help track and act on leading indicators?
To turn leading indicators into real outcomes, teams need help in three areas: understanding why signals change, getting timely alerts, and validating that interventions work. Enji supports each of these steps:
1. Root cause analysis and recommendations
🟣 How Enji helps: Enji eliminates hours of manual investigation by automatically connecting leading indicator changes to project events.
Project Narrative™ technology correlates signals with context: "Velocity dropped 30% following scope expansion (12 unplanned tickets), production incident response (85 hours firefighting), and vacation overlap (3 senior developers out)."
PM Agent translates signals into actionable recommendations: "Code review backlog at 25 PRs (normal: 8). Root cause: 2 senior reviewers on vacation. Recommendation: Temporarily distribute reviews to 3 mid-level engineers. Expected impact: Clear backlog within 3 days, restore velocity by sprint end."
2. Automated tracking and proactive alerts
🟣 How Enji helps: Enji eliminates 4-6 hours of weekly manual tracking by automatically monitoring technical and capacity indicators in real-time.
Team Code Metrics and Individual Code Metrics track code review velocity, work-in-progress trends, cycle time variance, and technical debt accumulation.
Enlightening Worklogs monitor overtime hours, context switching, and unplanned work percentage.
Routine Alerts notify managers when thresholds are crossed: "Code review backlog exceeded 20 open PRs" or "Work-in-progress increased to 18 tasks (capacity: 12)."
3. Portfolio patterns and validation
🟣 How Enji helps: Enji reveals organizational patterns across projects and validates which interventions actually work.
Summarizer creates portfolio health reports showing patterns like "80% of projects with overtime >50 hours/week missed deadlines within 4 weeks," driving targeted process improvements.
Enji creates closed-loop learning by tracking both early warnings and outcomes: "Code review backlog alert triggered week 2 → Review capacity increased → Velocity maintained 95% of target (vs. predicted 70% drop)."
Key Takeaways
- Leading indicators are forward-looking signals that predict future performance before results materialize, enabling proactive intervention, unlike lagging indicators that confirm outcomes after they occur.
- Leading indicators reduce problem-solving costs through early detection, preserve strategic options, protect team morale, and create a competitive advantage.
- Common examples include work-in-progress trends, code review velocity, technical debt accumulation, cycle time variance, overtime patterns, and test coverage trends.
- Choose effective indicators by aligning with your biggest risks, validating predictive power, ensuring actionability, and maintaining a focused portfolio.
- Enji enables leading indicator management through automated tracking, proactive alerts, root cause analysis, portfolio pattern recognition, and actionable recommendations.

Last updated in January 2026