Agile Metrics
Read this breakdown of the Agile metrics Enji uses to provide clarity into individual and team performance on projects.
What are Agile Metrics?
Agile Metrics are a set of key indicators that help teams monitor and analyze development processes. They provide insights into how tasks move through various stages, from creation to completion, and help assess efficiency, speed, and quality.
Agile Metrics help:
- Identify bottlenecks in development processes and address them.
- Evaluate team performance and task efficiency.
- Optimize delivery times for features and products.
- Improve work quality by analyzing task rejection rates.
- Maintain transparency in development processes for all team members.
By configuring and using Agile Metrics in Enji, teams obtain objective data, enhance workflows, and make informed decisions to achieve business goals.
Key metrics in Enji
- Lead Time – represents the entire lifecycle of a task, from creation to completion. An increase in this metric may indicate delays in planning, resource shortages, poor task distribution, or prolonged testing phases. This serves as a signal to investigate and resolve underlying issues.
- Cycle Time – focuses solely on the time spent actively working on a task, from start to finish. An increase in this metric indicates reduced task completion speed. Possible causes include more complex tasks, a higher task volume, or addressing technical debt. It's important to determine whether this is a temporary issue or a long-term trend.
- Time to Market – measures how long it takes to deliver new features or products to end users. Reducing this metric enhances customer satisfaction. If it is stable and customers are happy, no action is required. If customers are dissatisfied despite a stable metric, consider whether feature delivery is being delayed.
- Cycle Time from Worklog – tracks the time from the first worklog entry on a task to its completion (final status). A rising metric may point to inefficiencies in task execution after active work begins. Reassessing priorities or resource allocation could help address this.
- Actual Time Spent – analyzes how accurately developers estimate tasks. It compares the original estimation with the actual time spent. This metric highlights discrepancies between planned and actual time usage. Underestimation can overburden resources, while overestimation might slow progress.
- Rejection Rate – indicates how often tasks are sent back for rework after testing or code review. A high value suggests issues with task quality or unclear requirements. Check whether requirements are well-defined and whether quality standards are being met.
Task statuses and workflow
Since metrics depend directly on task start and end statuses, it is crucial to set up workflows correctly in a project's task tracker.
Typical task statuses:
- To Do or Open: Tasks that are created but not yet started.
- In Progress: Tasks that are actively being worked on.
- Code Review or Testing: Stages for quality checks.
- Done: Tasks that are fully completed.
- Released or Deployed: Tasks delivered to users.
- Pause or On Hold: Tasks temporarily paused.
Properly mapping these statuses to metrics in Enji ensures accurate data collection.
Configuration example:
| Enji Agile Metric | Start Status | Final Status |
|---|---|---|
| lead_time | To Do, Open | Done, Closed, Resolved |
| cycle_time | In Progress | Done, Closed, Resolved |
| time_to_market | To Do, Open | Deployed, Released |
| cycle_time_from_worklog | First worklog added | Done, Closed, Resolved |
| actual_time_spend | Not applicable | Done, Closed, Resolved |
| rejection_rate | In Progress | Code Review, Testing |
Configuring metrics
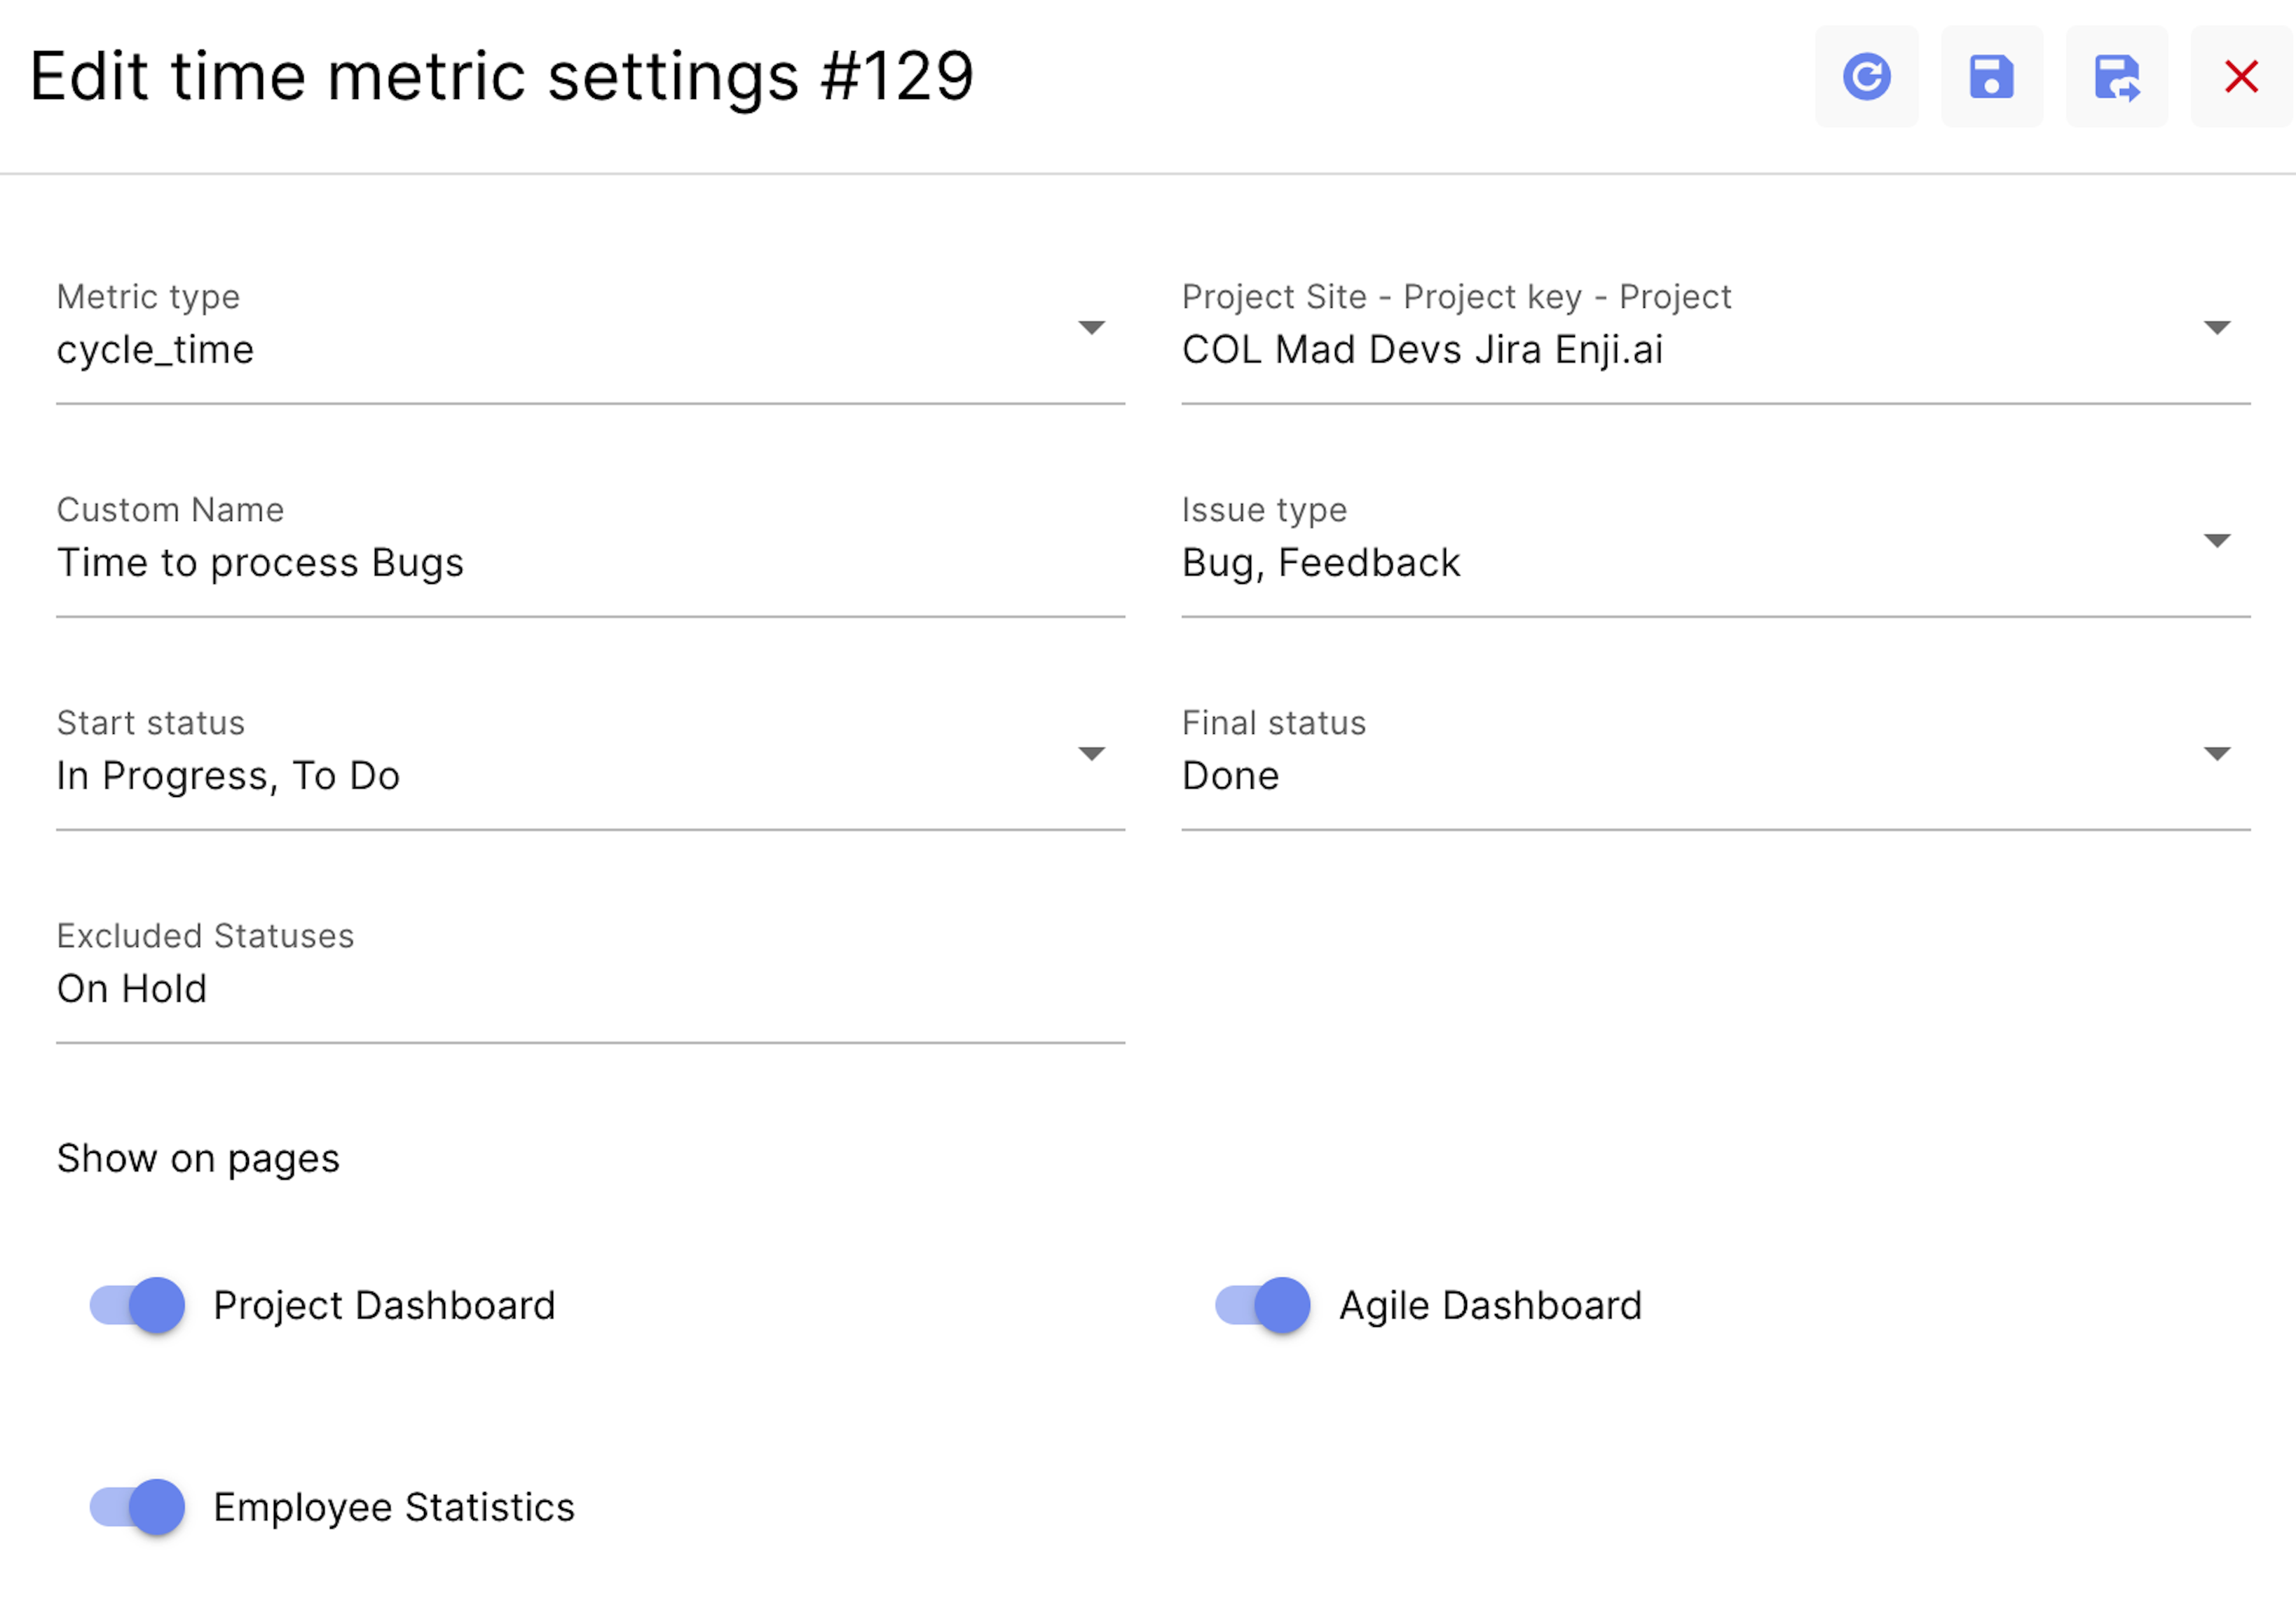
In Enji, metrics are configured for each project individually by following these steps:
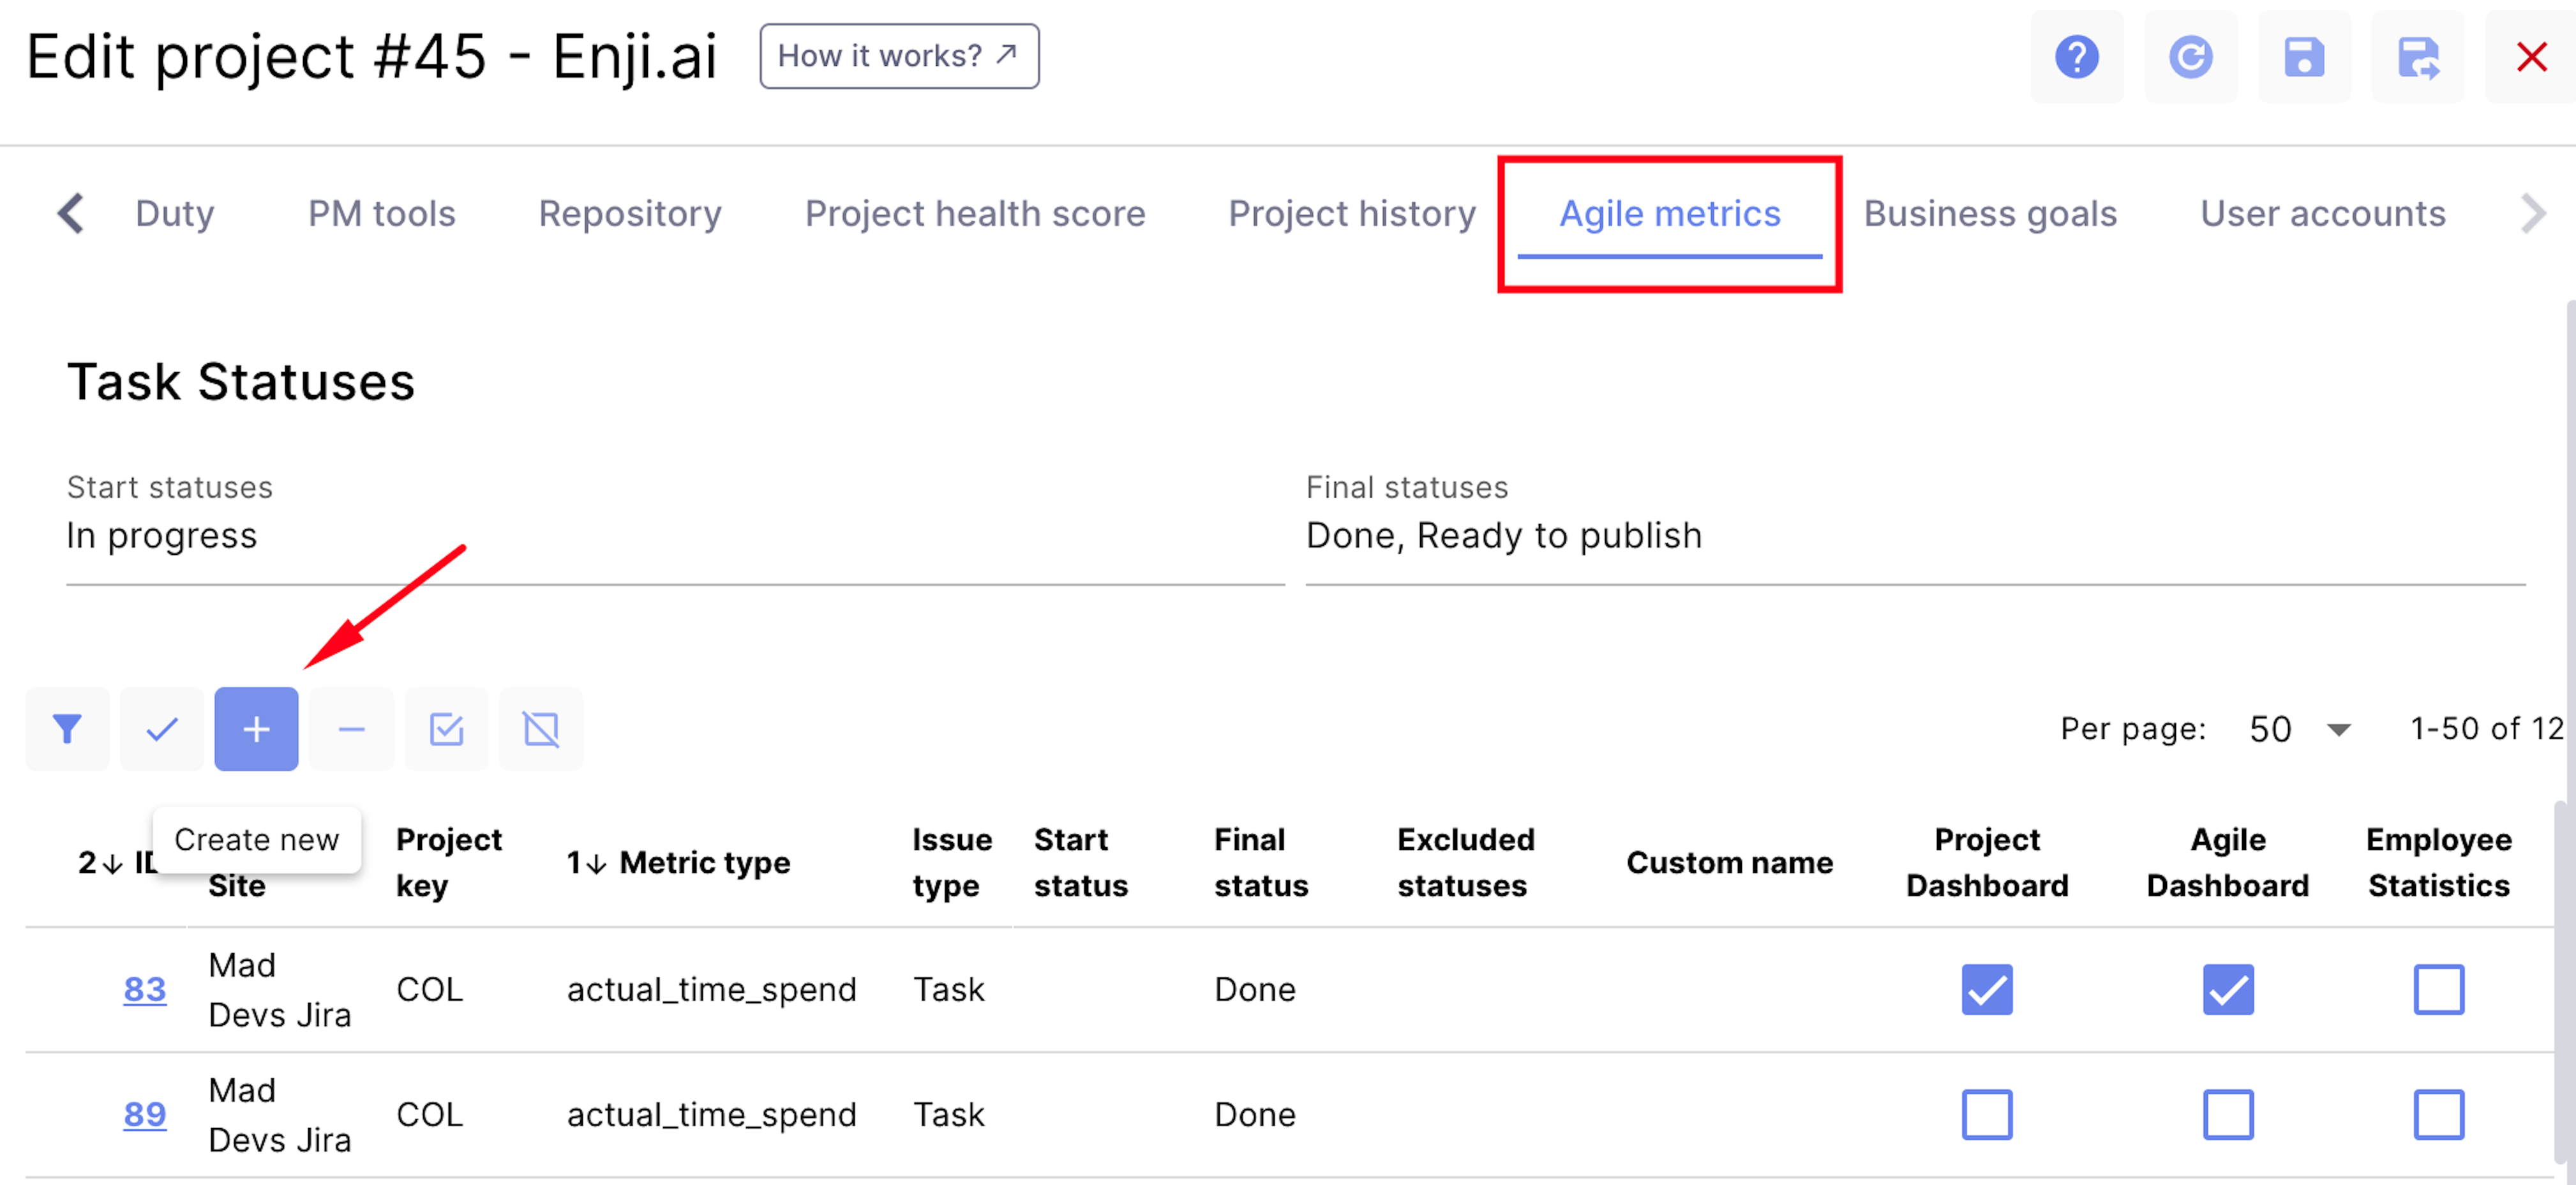
Settings -> Project List -> Project ID -> Agile Metrics tab and click "+".
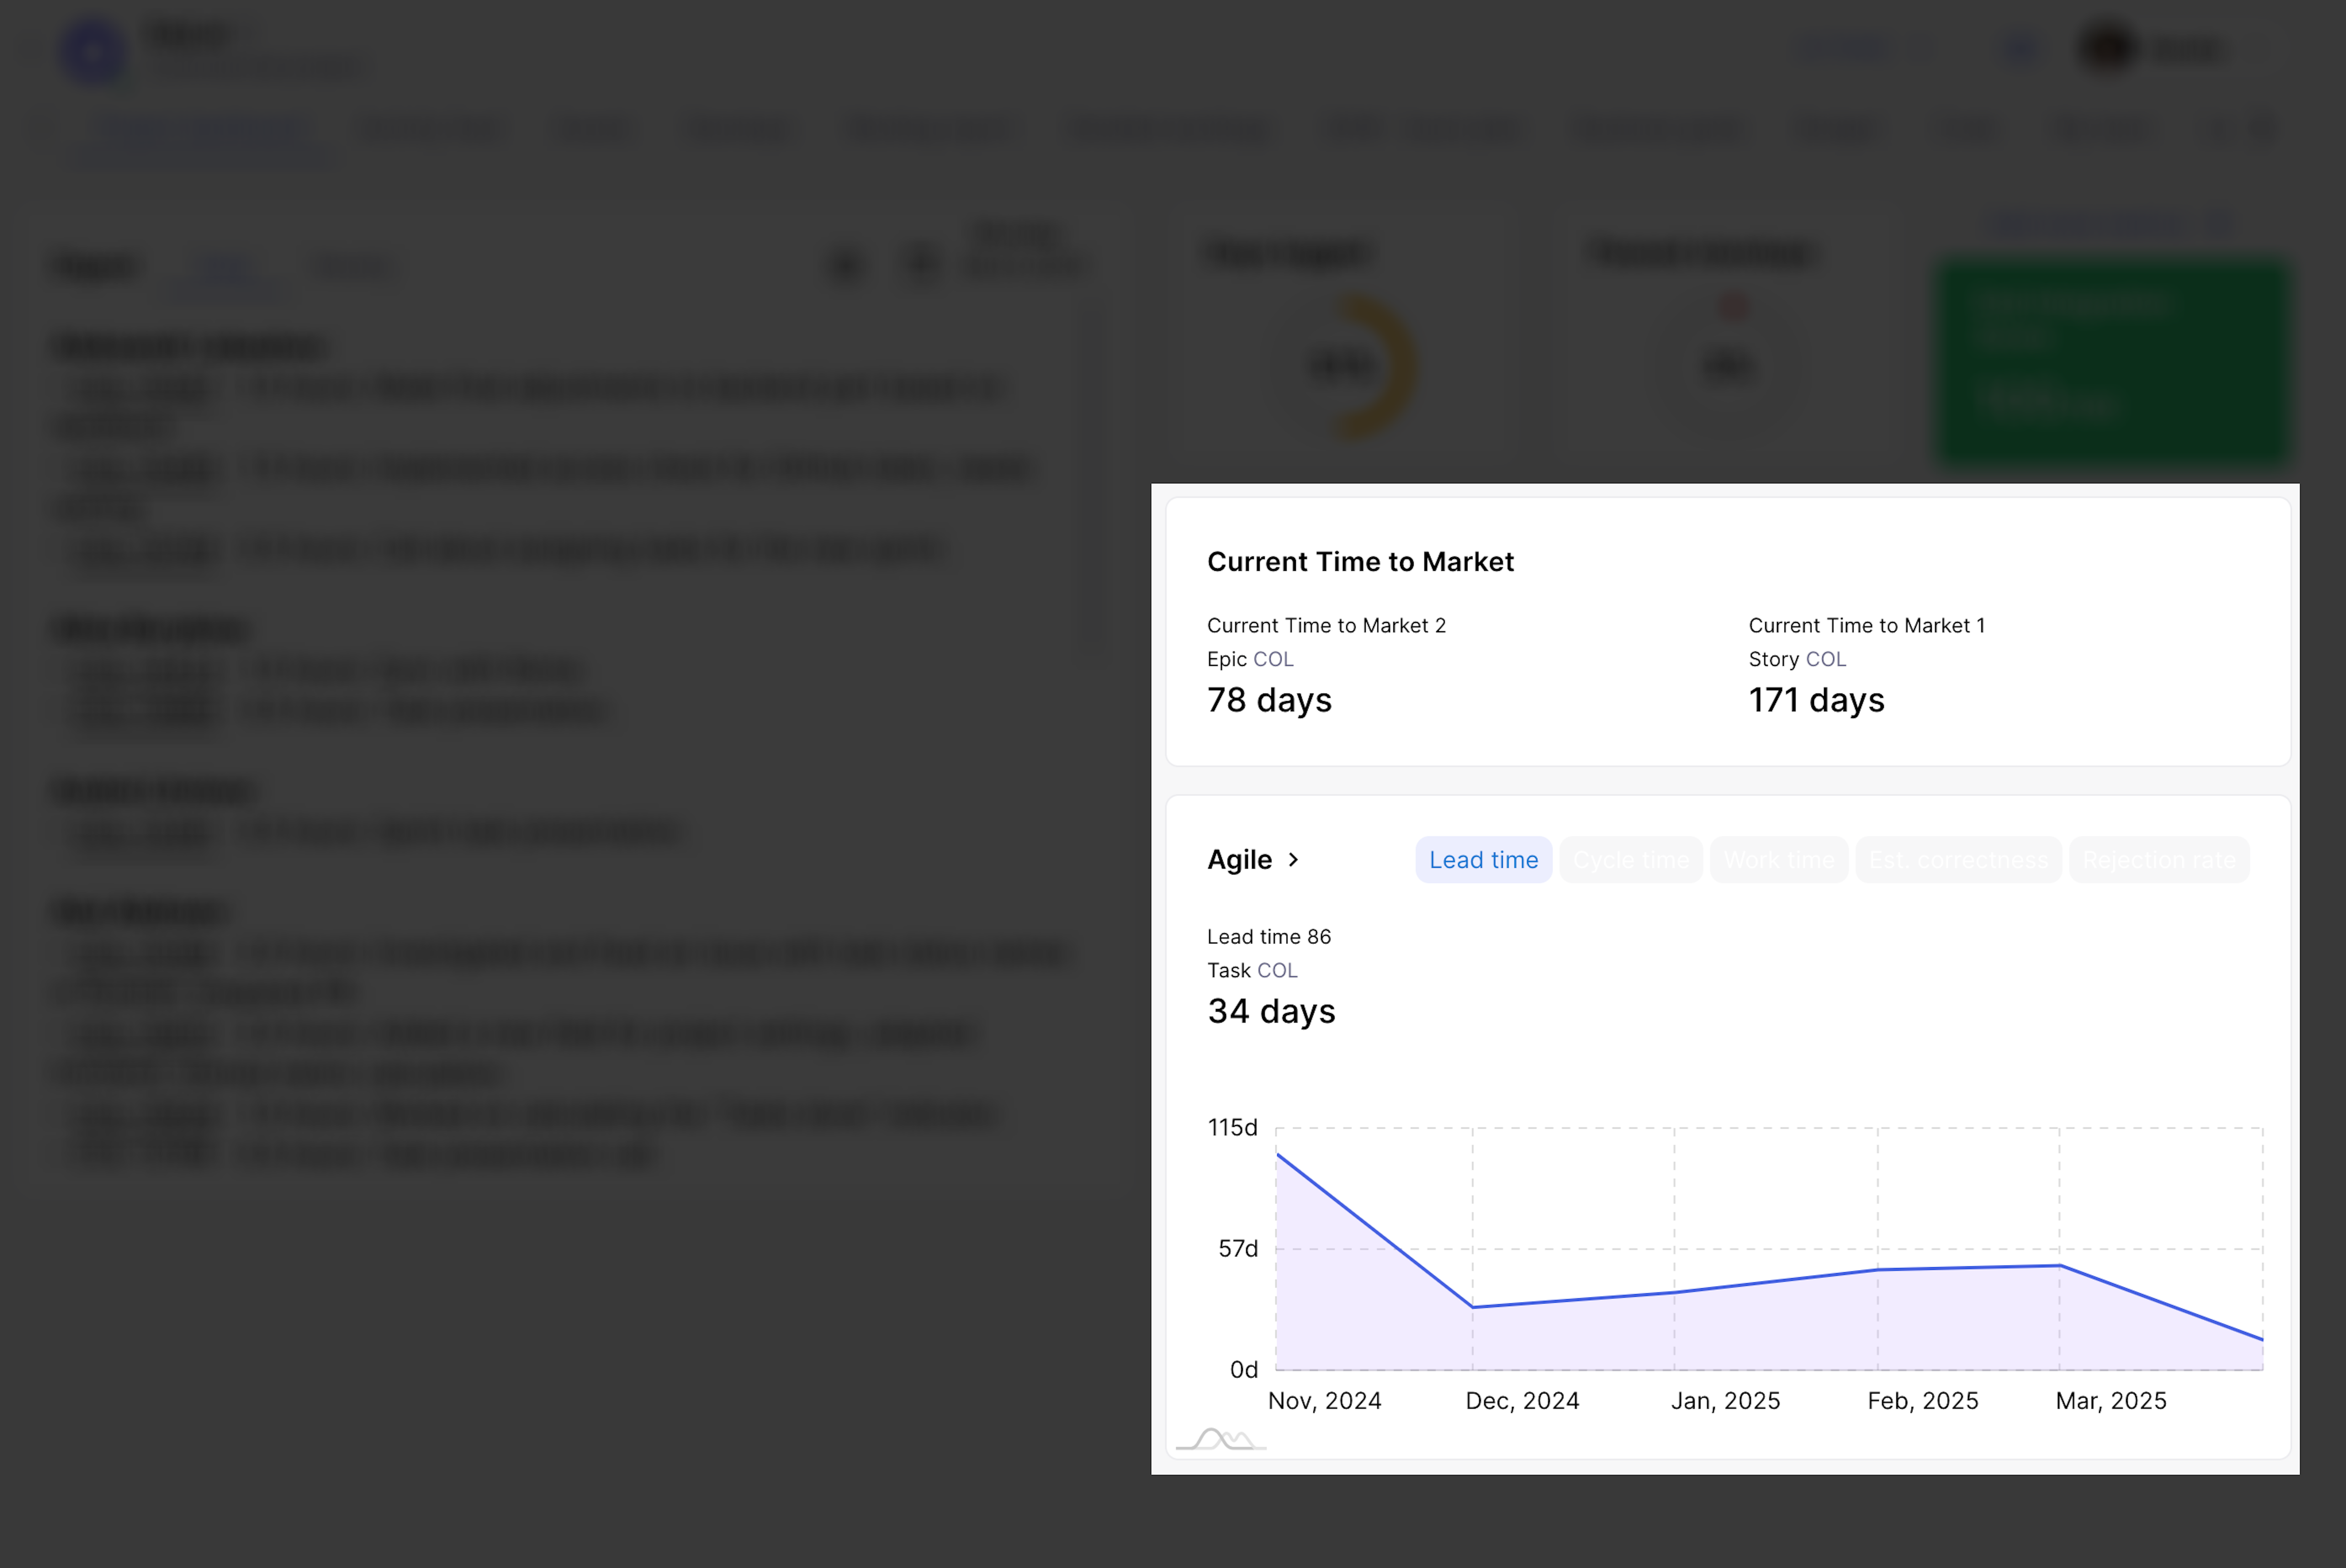
Project Dashboard metrics show average values for the last 3 months.


