From Data to Decisions: How to Use Project Management Metrics Effectively

Analyze with AI
Get AI-powered insights from this Enji article:
It is no secret that data is important, and the amount of data within a business grows with each new project and client. It is all around us and using it effectively can boost revenue and increase the speed of scaling. The Enji team believes in data-driven decisions that rely on facts and avoid speculation. Competition is high, and money is no longer cheap, which is why businesses are looking at productivity metrics.
The key is to use data as a signal to show business leaders what to focus on. There is no need to interfere with teams by having meetings when the information is available on a screen, especially when it is important to track the productivity of remote employees.
Project metrics and their signals
There are many metrics that managers can use to assess the health of projects and the performance of their software development teams, such as DORA and SPACE, that focus on the effort and output of engineering teams and the environment in which they work. The focus of this article will be on project management metrics, which we will explain in more detail later.
Regardless of the metrics you want to apply, remember Goldhart's Law: "When a measure becomes a target, it ceases to be a good measure." Instead of using the many numbers you can collect about a project or team as the reasons to make decisions, think of them as signals that point to potential issues. Let us look at this example:
A manager wants their team to release features more quickly. They look at the numbers and see that the average time tasks sit in each workflow status is one day. They think their teams can reduce the time to five hours. This manager has a choice.
Solution A:
They make the number the target and require their teams to keep their tasks in status for under five hours. There is no discussion, and the teams begin following the new rules.
The result:
The time tasks transition from one status decreases, showing excellent results on paper. Unfortunately, the teams now spend less time on tests and reviews. While they release features more quickly, there are problems, and users are upset.
Solution B:
The manager approaches their teams and explains the goal. The teams provide context on their work, showing that certain stages require more time than others to ensure higher quality.
The result:
The manager and teams agree on the maximum time to be spent on certain tasks. There is no single number, but individual goals for different stages. Features are released more quickly and without sacrificing tests and reviews.
In both solutions, the manager had project management metrics in front of them. In Solution A, the manager ignored the signals these metrics gave and approached the problem without considering the context. At the same time, Solution B demonstrates how a strategic manager can put performance metrics of team productivity to work in a positive manner that does not harm quality and contributes to an improved management and engineering relationship. Now we can examine these metrics and see the signals they give.
Project management metrics
In general, project management metrics include several groups of data that provide information on the time, costs, quality, scope, and risks related to a specific project or tasks within a project. Each group serves as signals that leaders can use to optimize current processes and to make strategic planning decisions for the future.
Time metrics
These metrics show the time spent on different aspects of a project related to development. Here are some common time metrics:
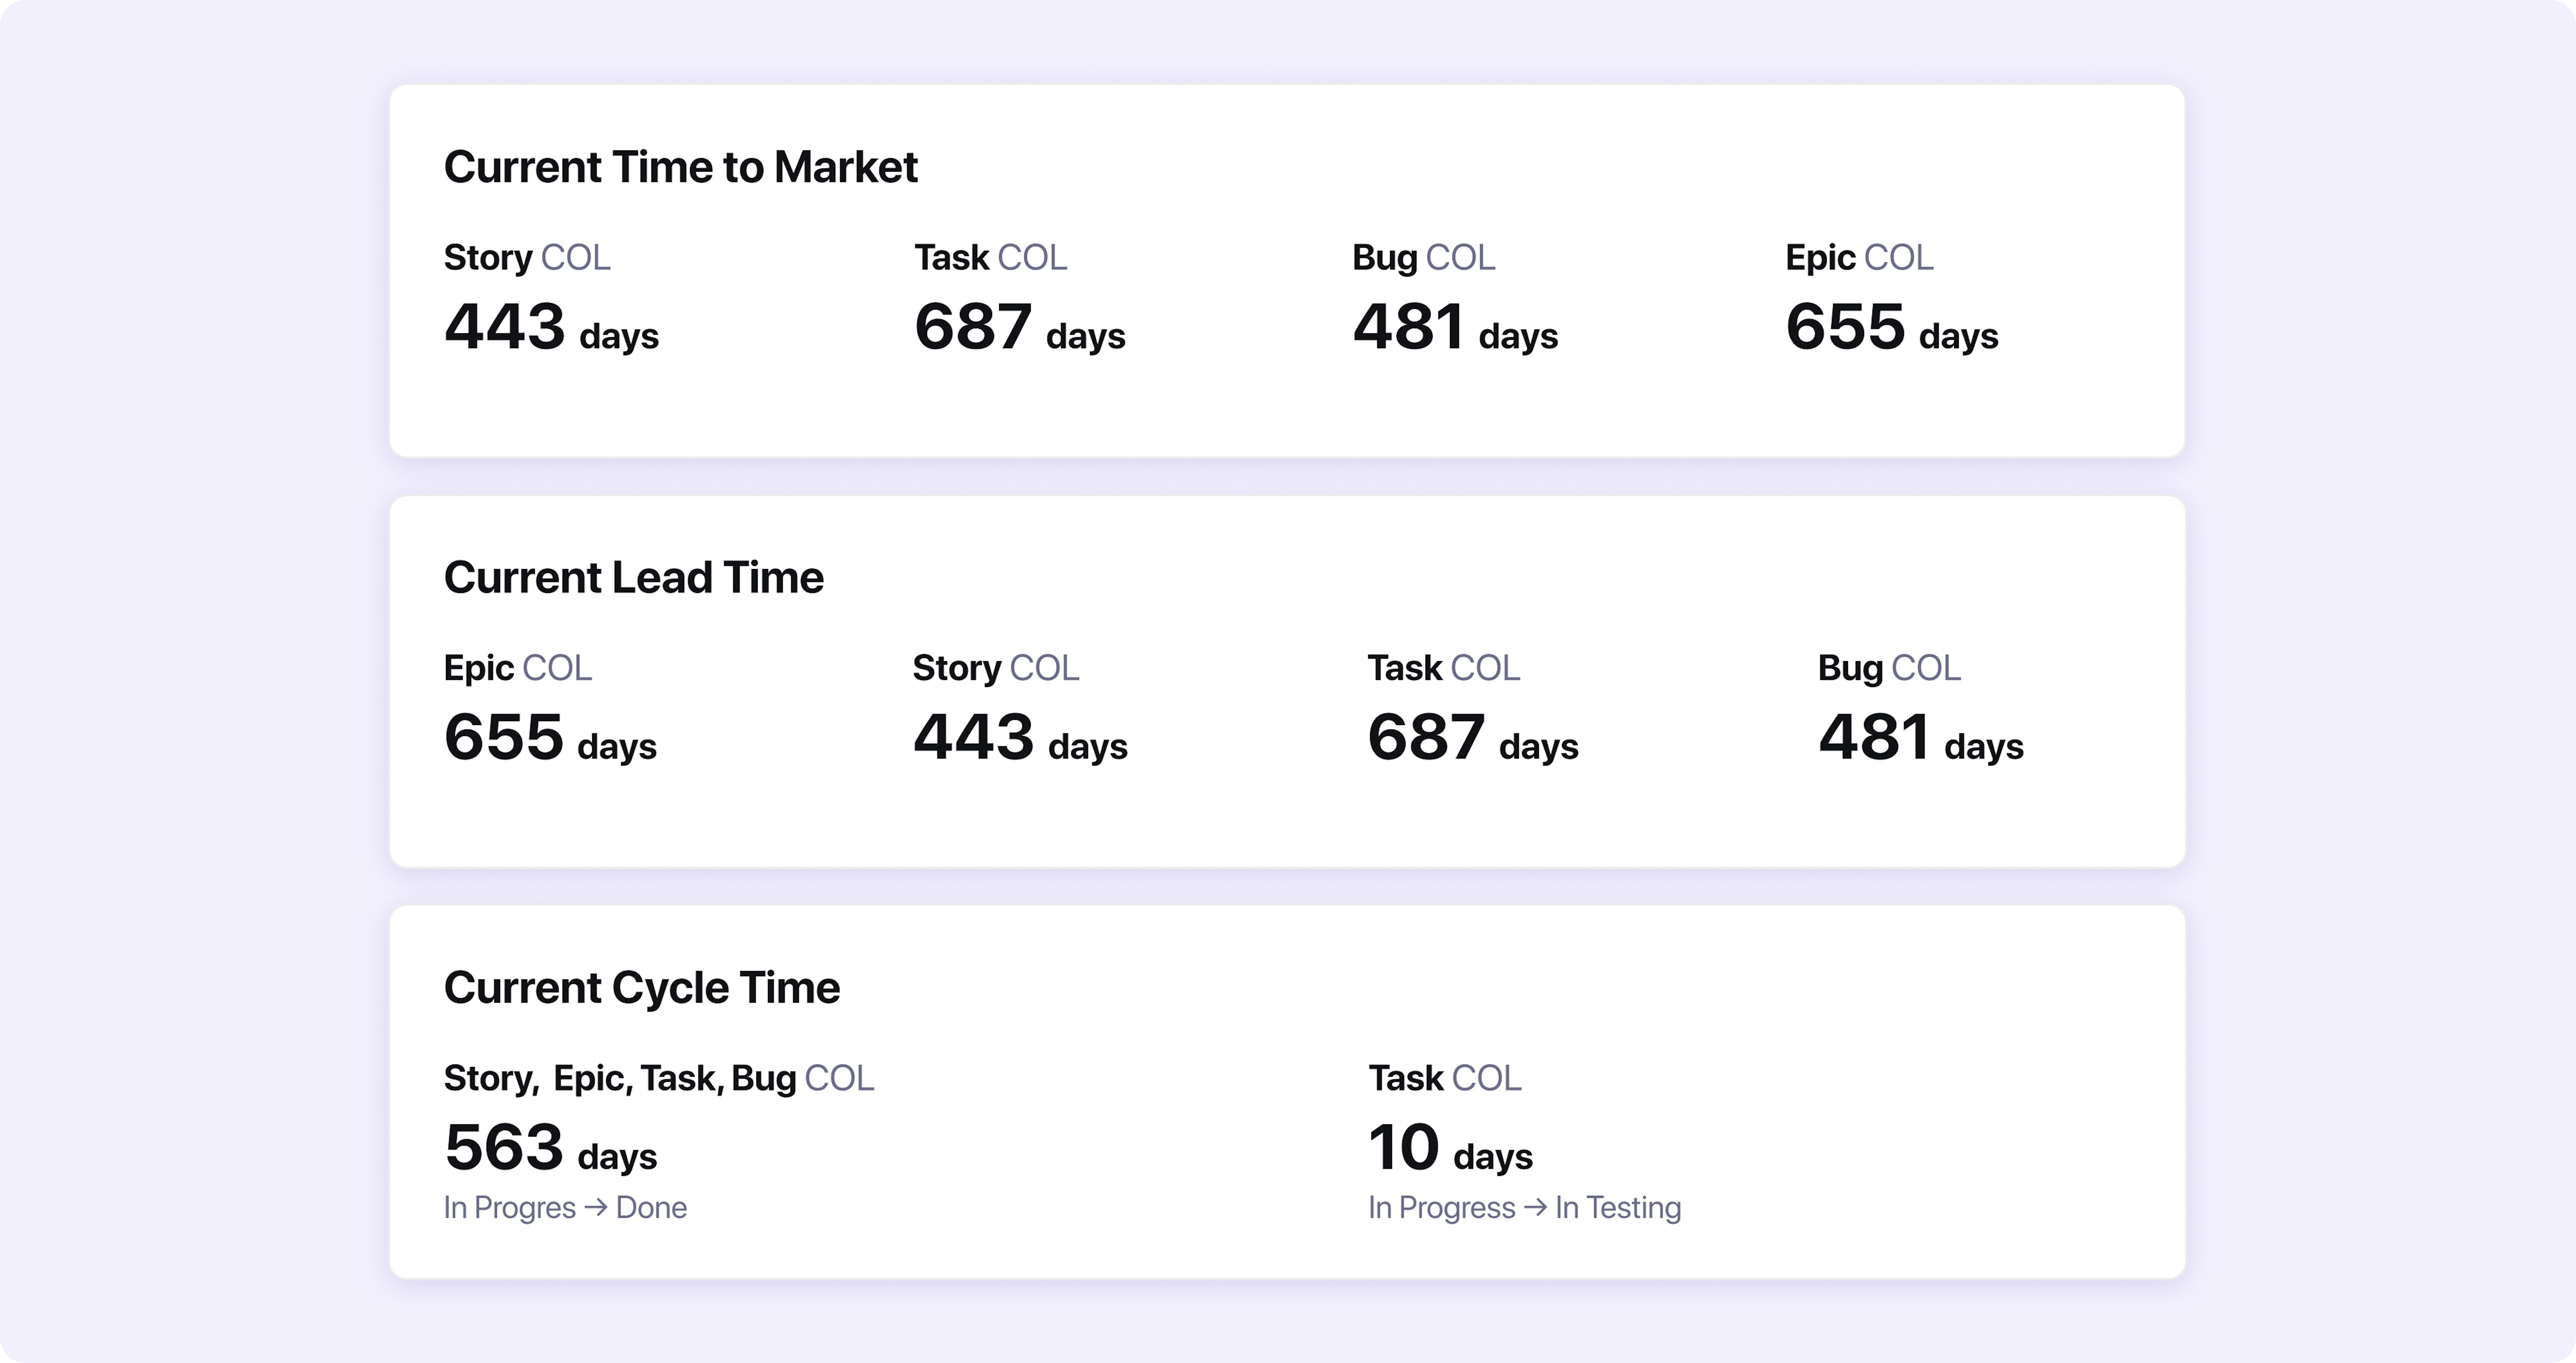
Cycle time: Measures how quickly a team completes tasks. It tracks the time taken to move a task from the initial status (for example, "To do") to the final status (for example, "Done") and calculates the average duration of this transition. This metric can signal a need to make adjustments to a workflow or approval process.
For example: A software development team completes user stories in their agile process with a total production time of 10 working days (80 hours). The team completes 20 user stories, spending 4 hours per story. This cycle time indicates that, on average, it takes 4 hours to complete a user story from start to finish.
Lead time: Measures the total time taken from task creation to reaching the final status. It helps assess the overall efficiency in handling tasks from inception to completion. This metric can signal to management that teams are
For example: A team is going to create a new feature and goes through several phases to do so: request submission, requirement gathering, design phase, development phase, testing phase, deployment day, review and feedback, and final adjustments. The process took 30 days from Day 1 to Day 30, meaning the total lead time is 30 days.
Time to market: Evaluates how quickly large tasks, such as Epics, progress from creation to delivery. It provides insights and signals about how quickly a team can deliver significant project components.
For example, the software development team from above has a time-to-market metric of 26 days, which includes request submission, requirement gathering, design phase, development phase, testing phase, and deployment day.
Estimated and actual time: Compares the time an engineer planned to spend on a task and the actual time spent. Gives signals on how well employees estimate work and what challenges they may have.
Cost metrics
Leaders can use these metrics to receive a breakdown of costs per task, epic, and project and review historical costs over the period of a company's existence.
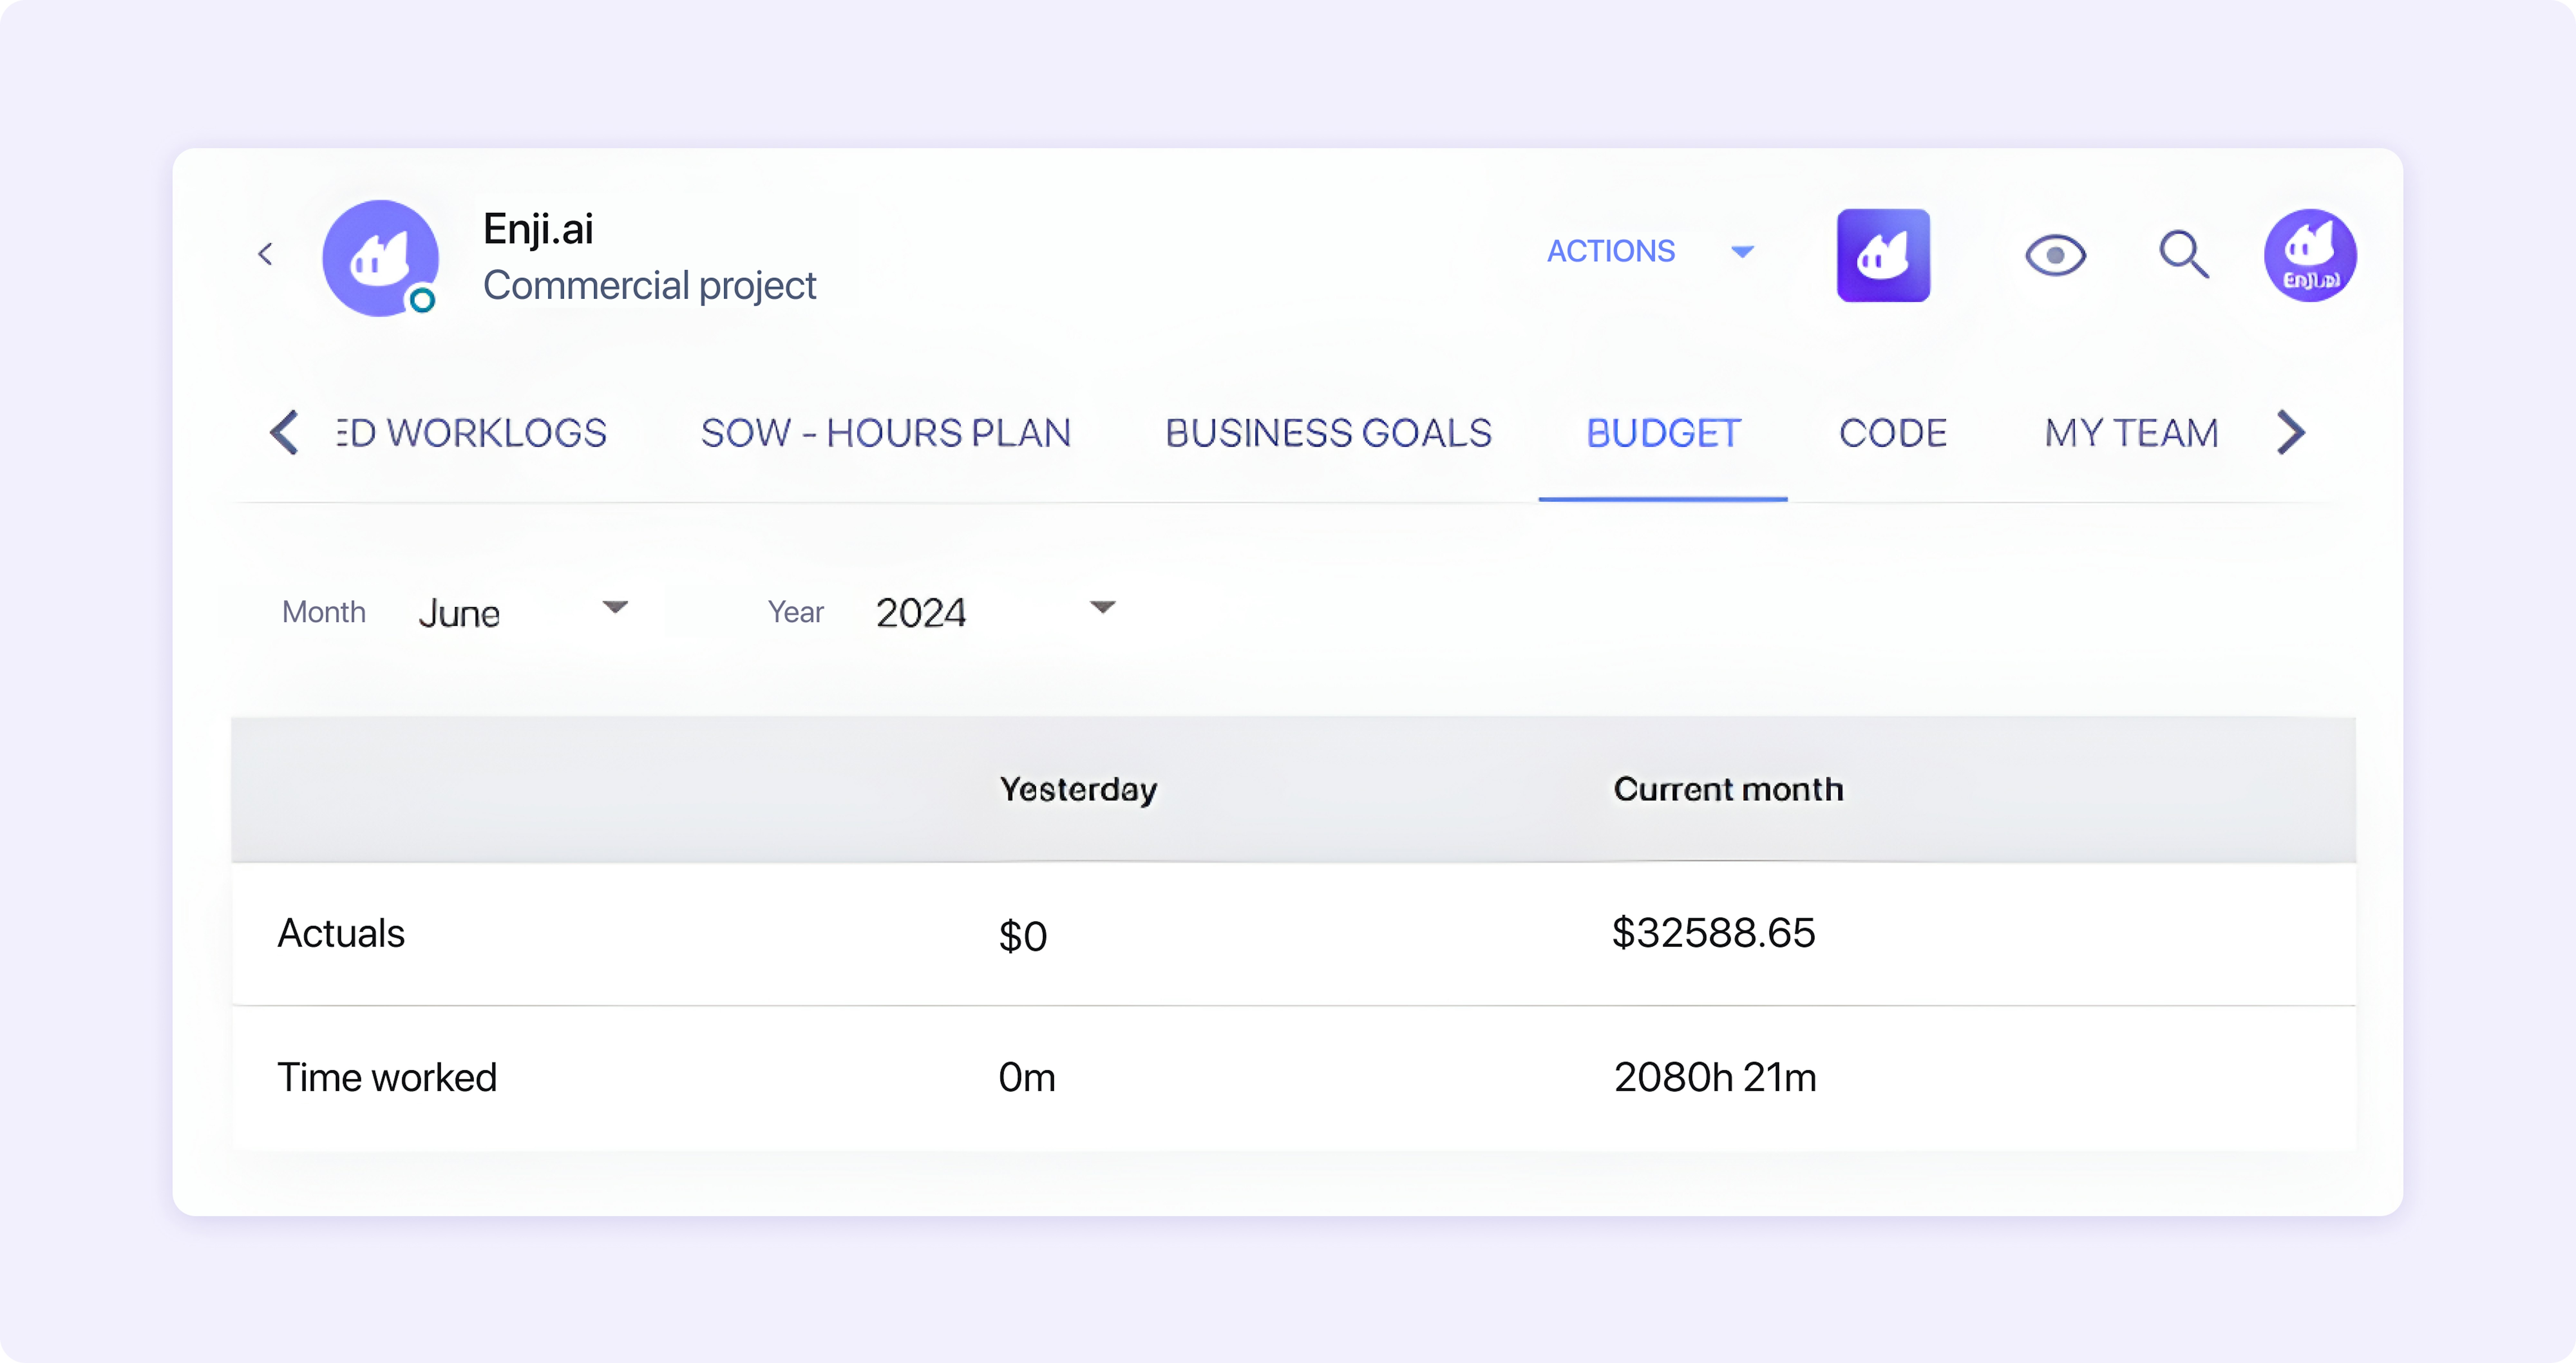
Project costs: Shows how much a project costs per day and month, taking into account the cost of the team and the hours spent. Sometimes, there are differences between how internal and commercial projects are billed, and this metric can be adjusted to show these variations. Enji and other tools can do this. These metrics signal if a project regularly remains under or exceeds expected costs.
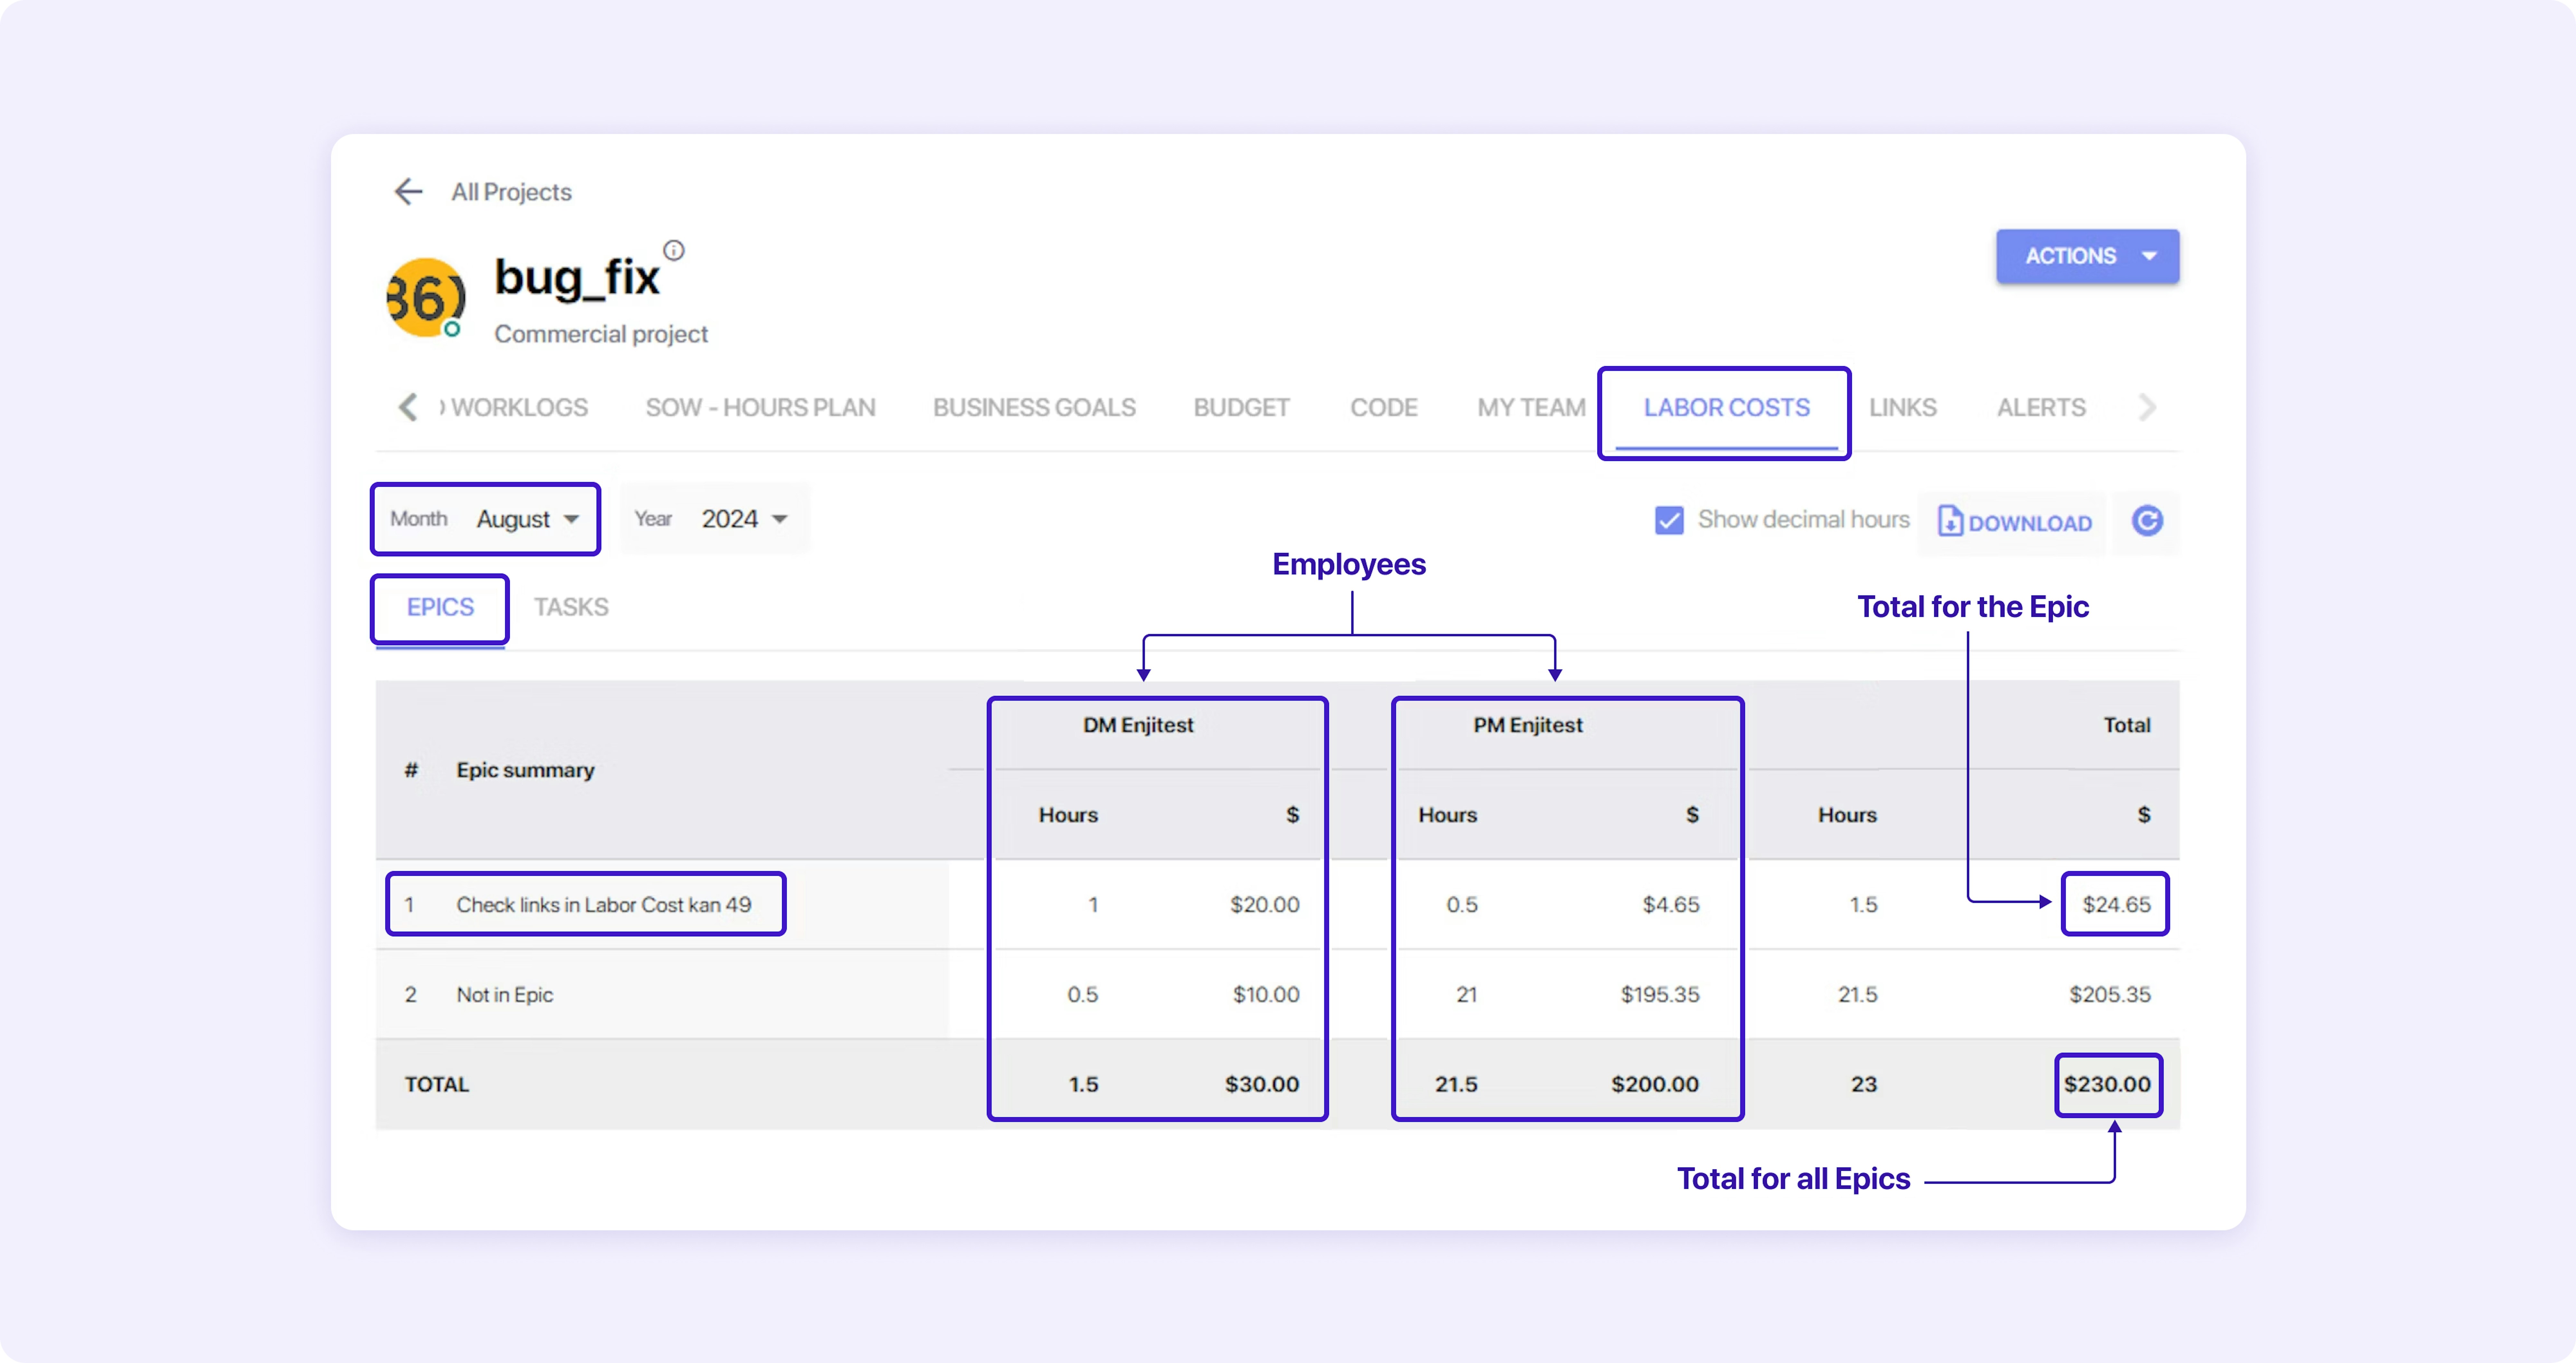
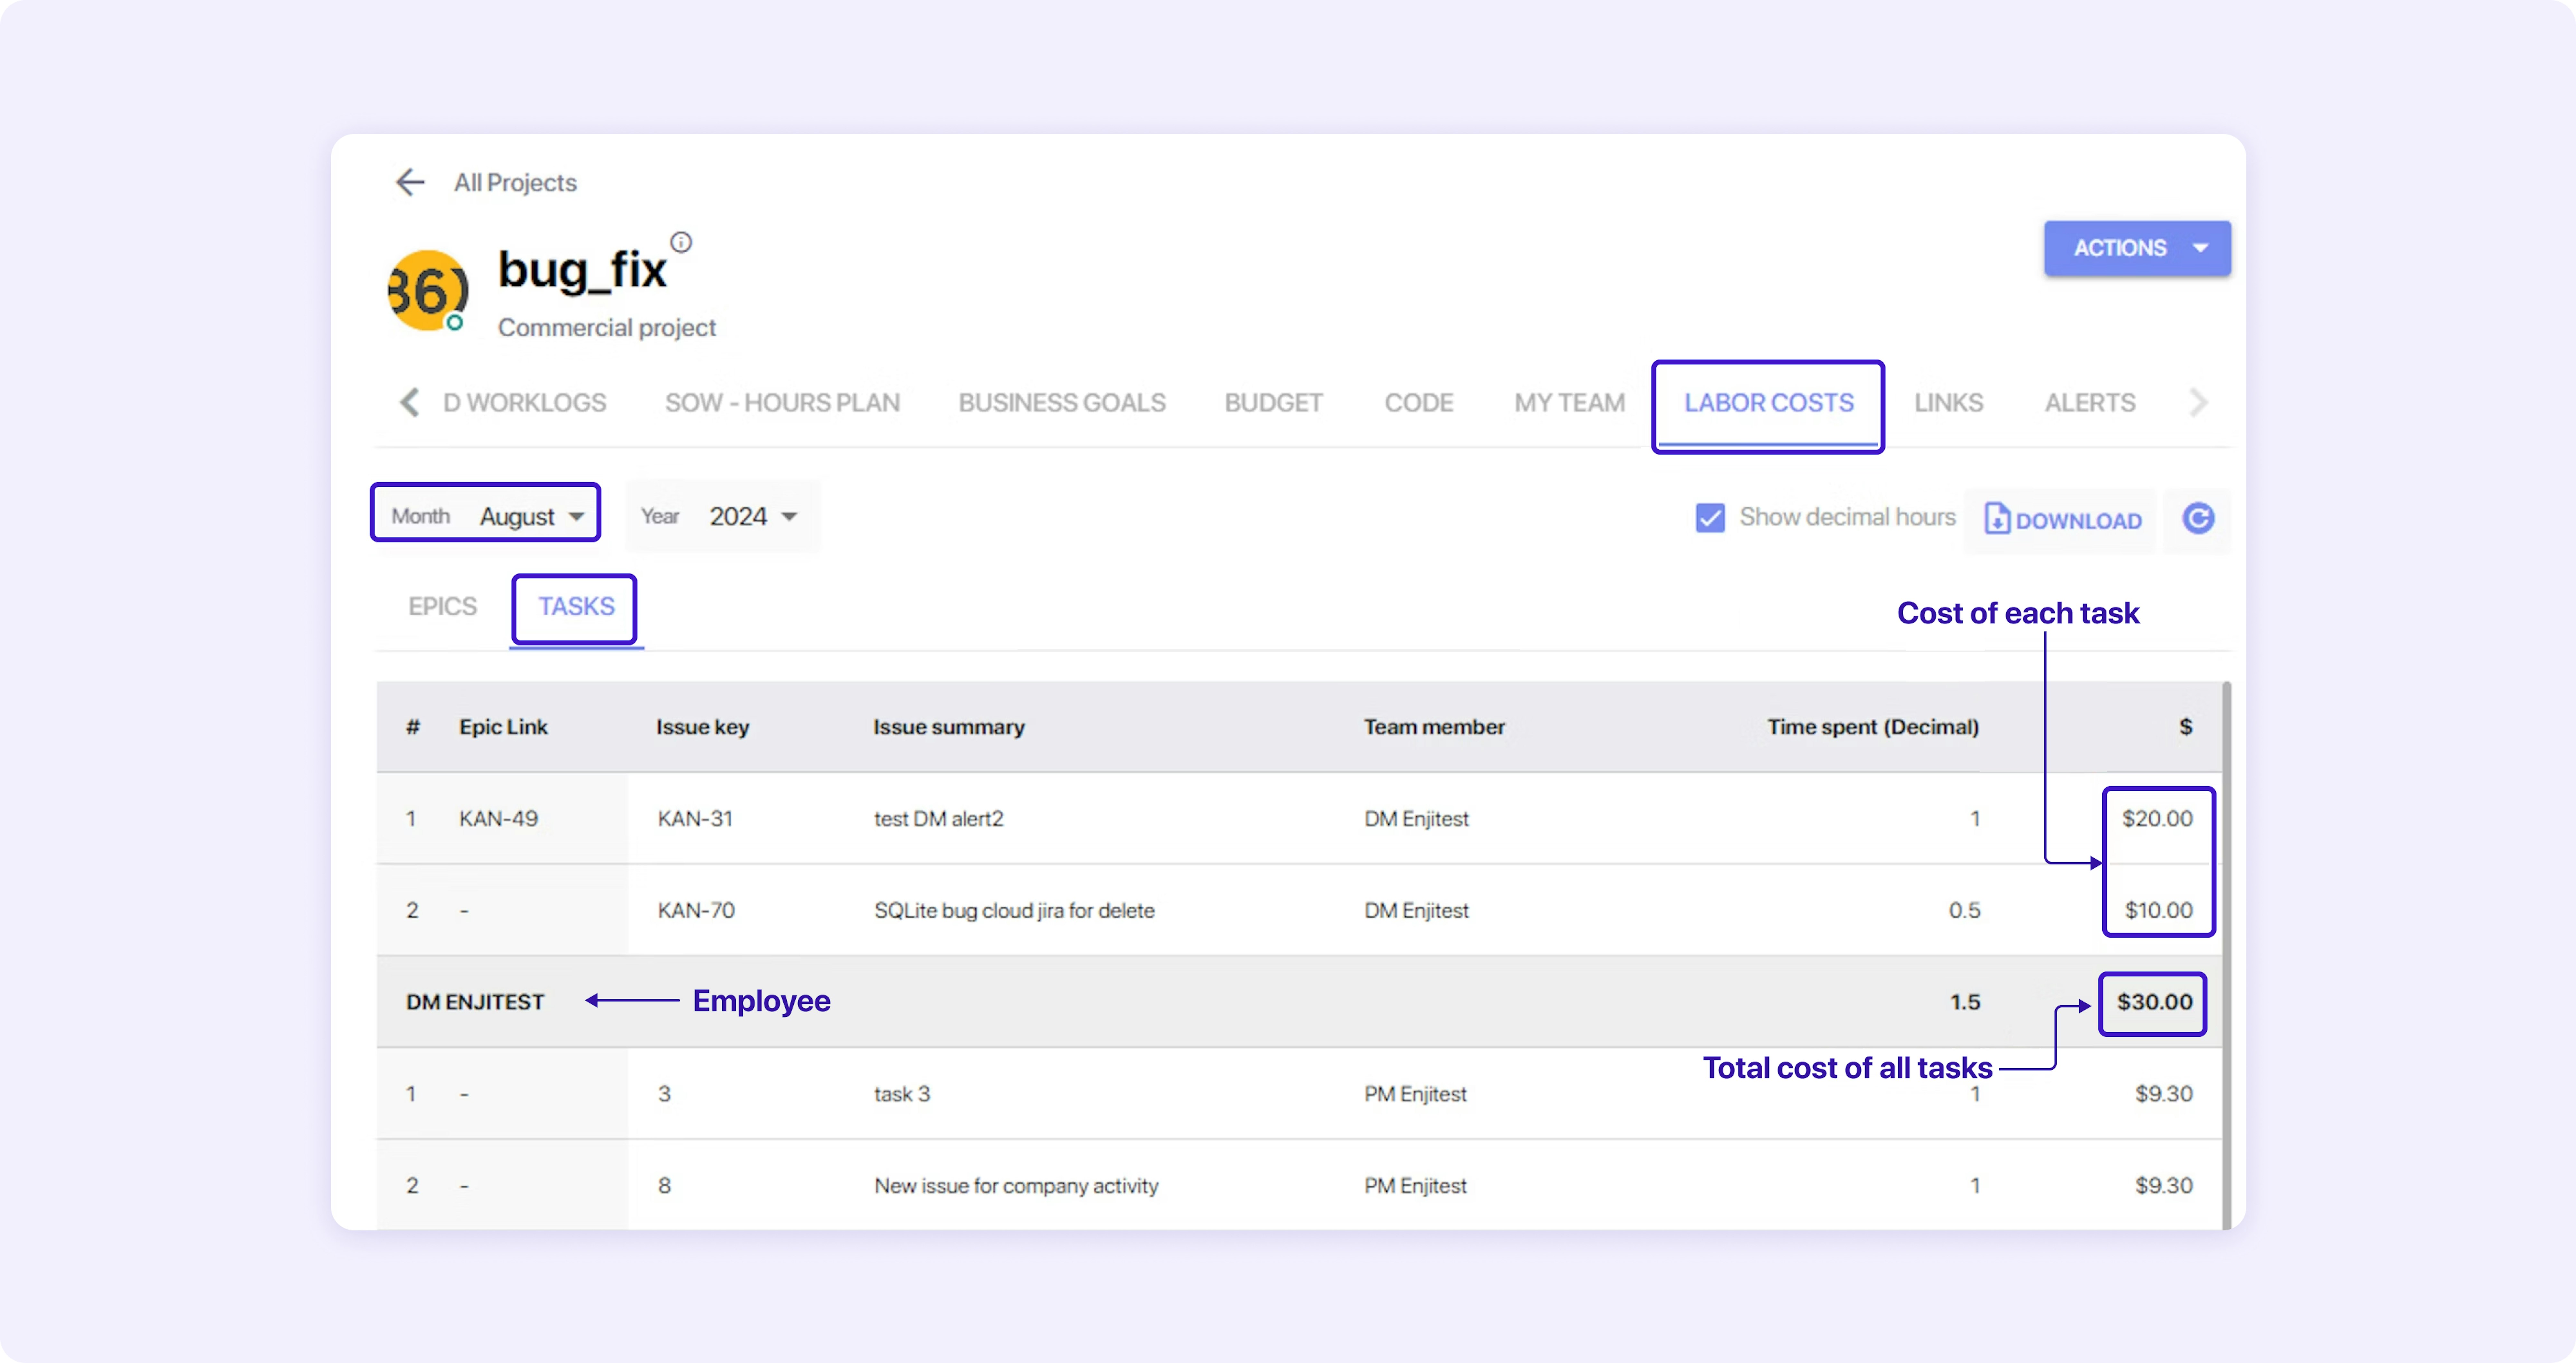
Labor costs: Help understand the expense of work done on Epics/Tasks within a project each month based on an employee's hourly rate and the hours logged in the Epic/Task. Can also be adjusted for internal and commercial projects. Signals if rates are fair or exceed expectations.
This example shows the cost of each Epic and the Total for all Epics in August:
This example shows the cost of each Task and the Total per employee for August:
Quality metrics
High-quality code leads to better products and higher customer satisfaction. Measuring the quality of code is possible with the right metrics. Here are four examples:
Code churn: Measures the changes made to code over a period of time, including additions and deletions. Can signal if engineers have difficulty producing code that does not require many changes. Displayed as a percentage or absolute count.
Defect density: Displays how many confirmed defects there are in relation to the size of the code. Signals difficulties in testing and reviewing code. Displayed as defects per KLOC (thousand lines of code).
Mean time to detect (MTTD): Shows the average time it takes to identify a defect or failure. This signal can point to excellent or poor communication, depending on the data. Displayed as time (hours/days).
Rate of crash: Gives the frequency of crashes within a specific timeframe. Can signal that code does not perform well and requires a review and if teams respond adequately to fixing root causes. Displayed as a rate (e.g., crashes per hour/session).
Scope metrics
Besides the data that provides a high-level view of the time engineers work and the quality of their work, there is more detailed information that can help managers keep projects within scope and signal if something is wrong in the workflow.
Expected hours: In tools like Enji, it's possible to indicate the number of hours an employee should work on a project per month. This signals to leaders if someone is spending more or less time on the project than expected for them to understand why.
Daily hours: It can also be helpful to set the number of hours an employee should work daily. This can match their contract and the company's overall workload. It serves as a signal for the employee and leadership about their ability to properly prioritize a project and their other responsibilities.
Acceptable deviation: Based on the expected and daily hours, it is useful to specify how many hours per day an employee is allowed to exceed the Daily Hours limit.
Paid hours: The number of monthly hours for which the client will be billed. For example, Expected Hours might be 160 hours and Paid Hours 80, as the agreement with the client is that they will pay for only 80 hours of work per month.
Risk metrics
This information identifies, assesses, and quantifies potential threats or uncertainties that could negatively impact a project or product.
- Probability of schedule overruns: Estimates the likelihood that a project will miss its deadlines. This metric uses historical data and assesses factors like task completion rates, dependency management, and resource allocation to gauge the probability of delays.
For example, a software project that experienced delays in the design and integration phases may be given a 40% probability of schedule overrun.
- Likelihood of budget exceedance: Measures the probability that the project will exceed its allocated budget. This metric considers current spending rates, scope changes, resource costs, and any unanticipated expenses using cost variance (CV), burn rate, and historical performance data.
For example: If a project is trending 20% over budget halfway through development, it might be flagged as having a 70% likelihood of budget exceedance unless corrective actions are taken.
- Number of high-severity vulnerabilities: Tracks the number of critical security vulnerabilities identified during development, testing, or after deployment. These are issues that pose a significant risk to the security and functionality of the system.
For example: A system with 15 high-severity vulnerabilities might trigger immediate risk mitigation efforts, as opposed to a system with only 1 or 2 high-severity issues, which may be easier to address.
- Complexity of integration with existing systems: Assesses how difficult it is to integrate new software with legacy systems or other third-party applications. High integration complexity increases the risk of delays, bugs, and system failure.
For example: A project with multiple legacy systems requiring customized API development and data migration would be rated as having high integration complexity, increasing the risk of delays and bugs.
- Team turnover rate: Measures the frequency at which team members leave the project or organization as a percentage over a specific period. High turnover can lead to lost productivity, reduced expertise, and an increased risk of project failure or delays.
For example: A project that loses 3 out of 10 team members over six months would be considered at high risk due to a 30% turnover rate, potentially leading to missed deadlines or reduced code quality as new members begin to work.
Putting metrics to work
Let us return to our example situation at the beginning. The best solution was when the manager used the metrics they observed as a signal to take action. They approached their team and asked questions to understand the reason before making decisions that could harm the team and the company in the long term.
Data and metrics give leaders an important perspective on project, team, and individual performance. Still, they are only part of the context, and the Enji team stresses the need for responsible, data-driven decisions. Just having the data is not enough. Use metrics as signals to save time exploring issues through positive control. Enji combines these metrics in summaries and reports that leaders can generate in minutes in a single dashboard.


