Enji Is a Platform That Gives CEOs, CTOs, and CPOs Full Visibility Into Development


Analyze with AI
Get AI-powered insights from this Enji article:
In recent years, tech companies have encountered a phenomenon known as "managed chaos": teams expand, while process transparency declines. Leaders increasingly talk less about "who is doing the tasks" and more about what they can actually see in the context of development.
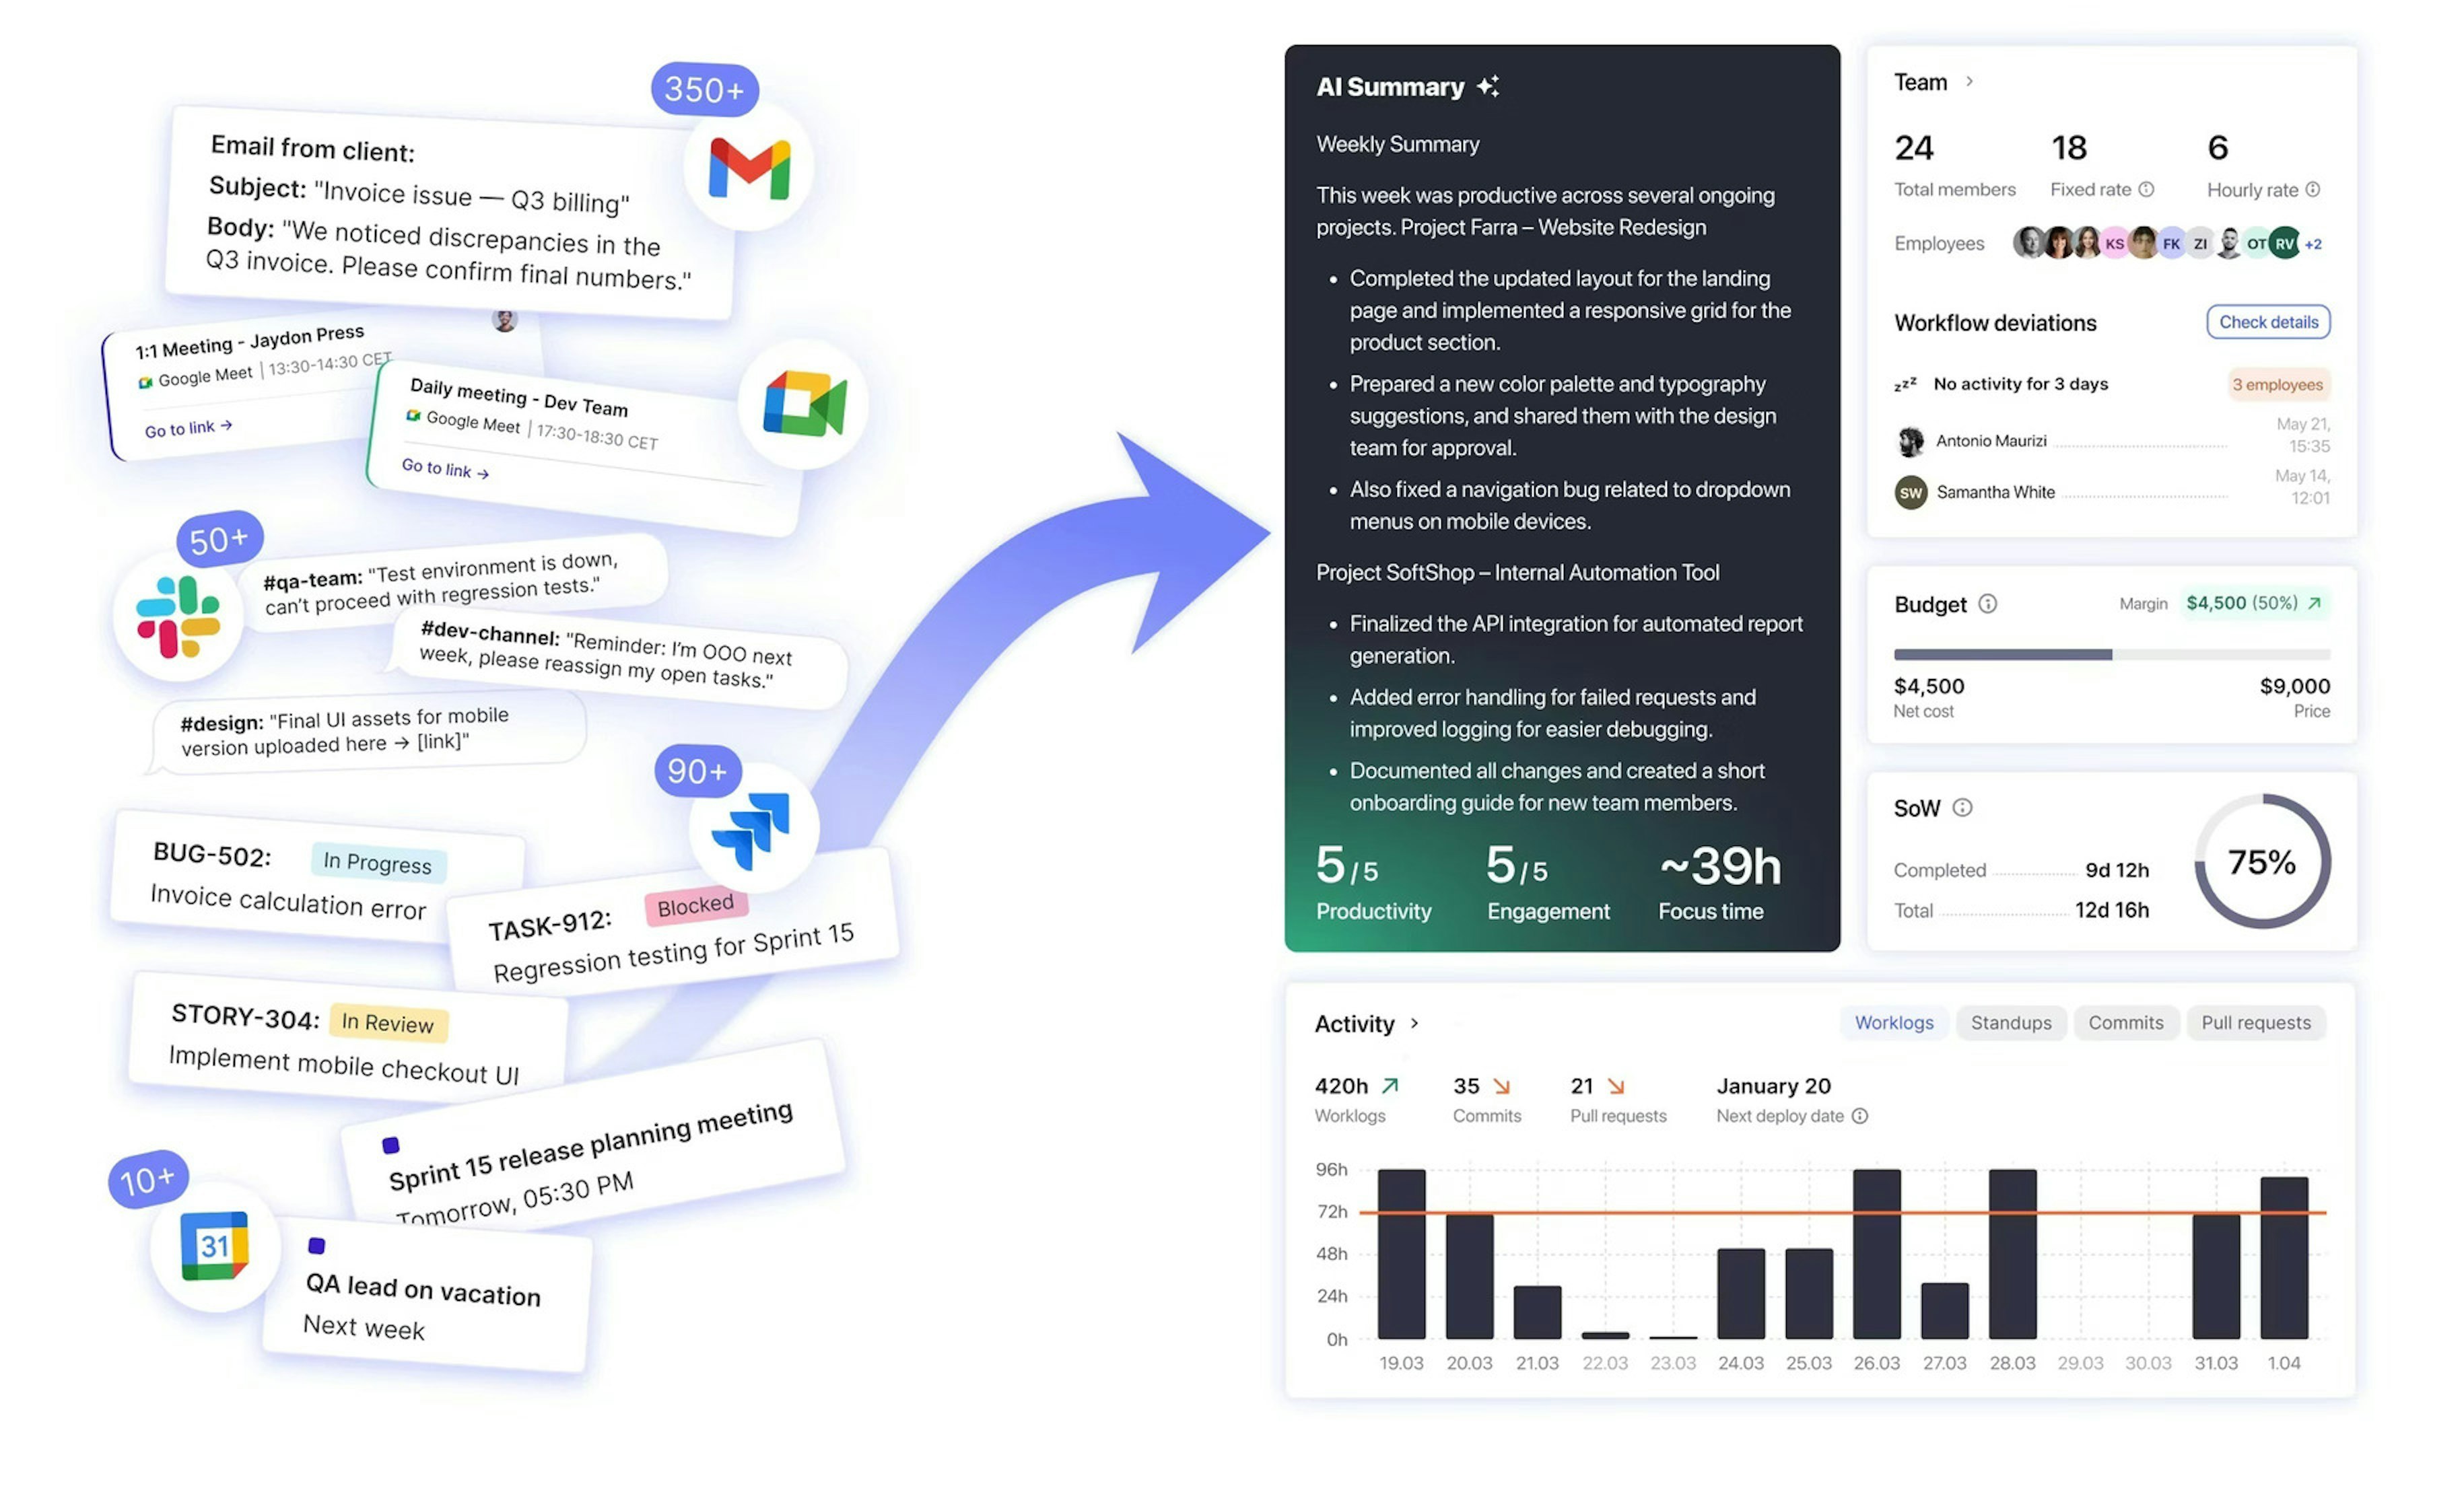
The problem is that the reality of delivery is fragmented: tasks reside in Jira, code is stored in GitHub, context and agreements are maintained in Slack, and the numbers are kept in separate spreadsheets and reports. These systems are useful for tactical coordination, but for top management, they remain a fragmented mosaic where each piece reflects only a portion of the context:
- The CEO sees only budgets and release stages.
- The CTO manages teams through status reports.
- The CPO tracks the backlog, trying to keep delivery forecasts on track.
As a result, none of these roles sees the full picture: the actual state of development, the speed at which business value is created, and real-time team dynamics. Without an end-to-end view, it's impossible to understand where time is being lost, how resources are allocated, and what contribution specific teams are making toward strategic goals.
In this article, we'll break down what data executives need to make decisions about priorities, risks, and cost; why it can't be collected from a single tool; and how Enji provides a unified, C-level view of software delivery.
Why can project managers work without Enji, but CEOs, CPOs, and CTOs can't?
Project management tools cover the operational loop: planning, coordination, status control, and communication during delivery. That's enough to run sprints and keep the team's commitments on track.
But at the CEO/CTO/CPO level, the focus shifts from managing tasks to managing the delivery system itself. Executives need answers to a different class of questions:
- Why did delivery speed change, and where did the constraint form?
- How do we spot risk before timelines are threatened?
- What happens if we reprioritize or reallocate resources?
- What does it actually cost to build an initiative/feature, based on real data?
- How do we calculate ROI at the portfolio level, not "on average per team"?
- Where should my attention go right now — which area is creating the biggest risk or the greatest loss of time/money today?
Traditional tools don't provide these answers because information is scattered across tasks, code, communication, and financials. Enji brings it together into a single system: it connects sources into one coherent context and converts raw data into decision-ready executive insights.
To keep the conversation concrete, let's define Enji's management model without listing dozens of features.
The Enji capabilities C-level leaders rely on
- PM Agent: context-linked answers and reports in your inbox/messenger
PM Agent "pulls together" data from tasks, code, and discussions and returns structured answers to leadership questions. It also supports generating and regularly sending automated reports, based on objective data about activities and roadmap blocks. - AI Tools / Summarizer: executive briefings instead of manual reporting
Summarizer produces concise project updates from standups and task activity, reducing the need for extra syncs and manual status collection. - Code Metrics: observability for engineering dynamics
Code Metrics surface signals about progress and "project health" from engineering data, translating engineering indicators into business-relevant insights. - Financial Metrics: cost and margin as controllable variables
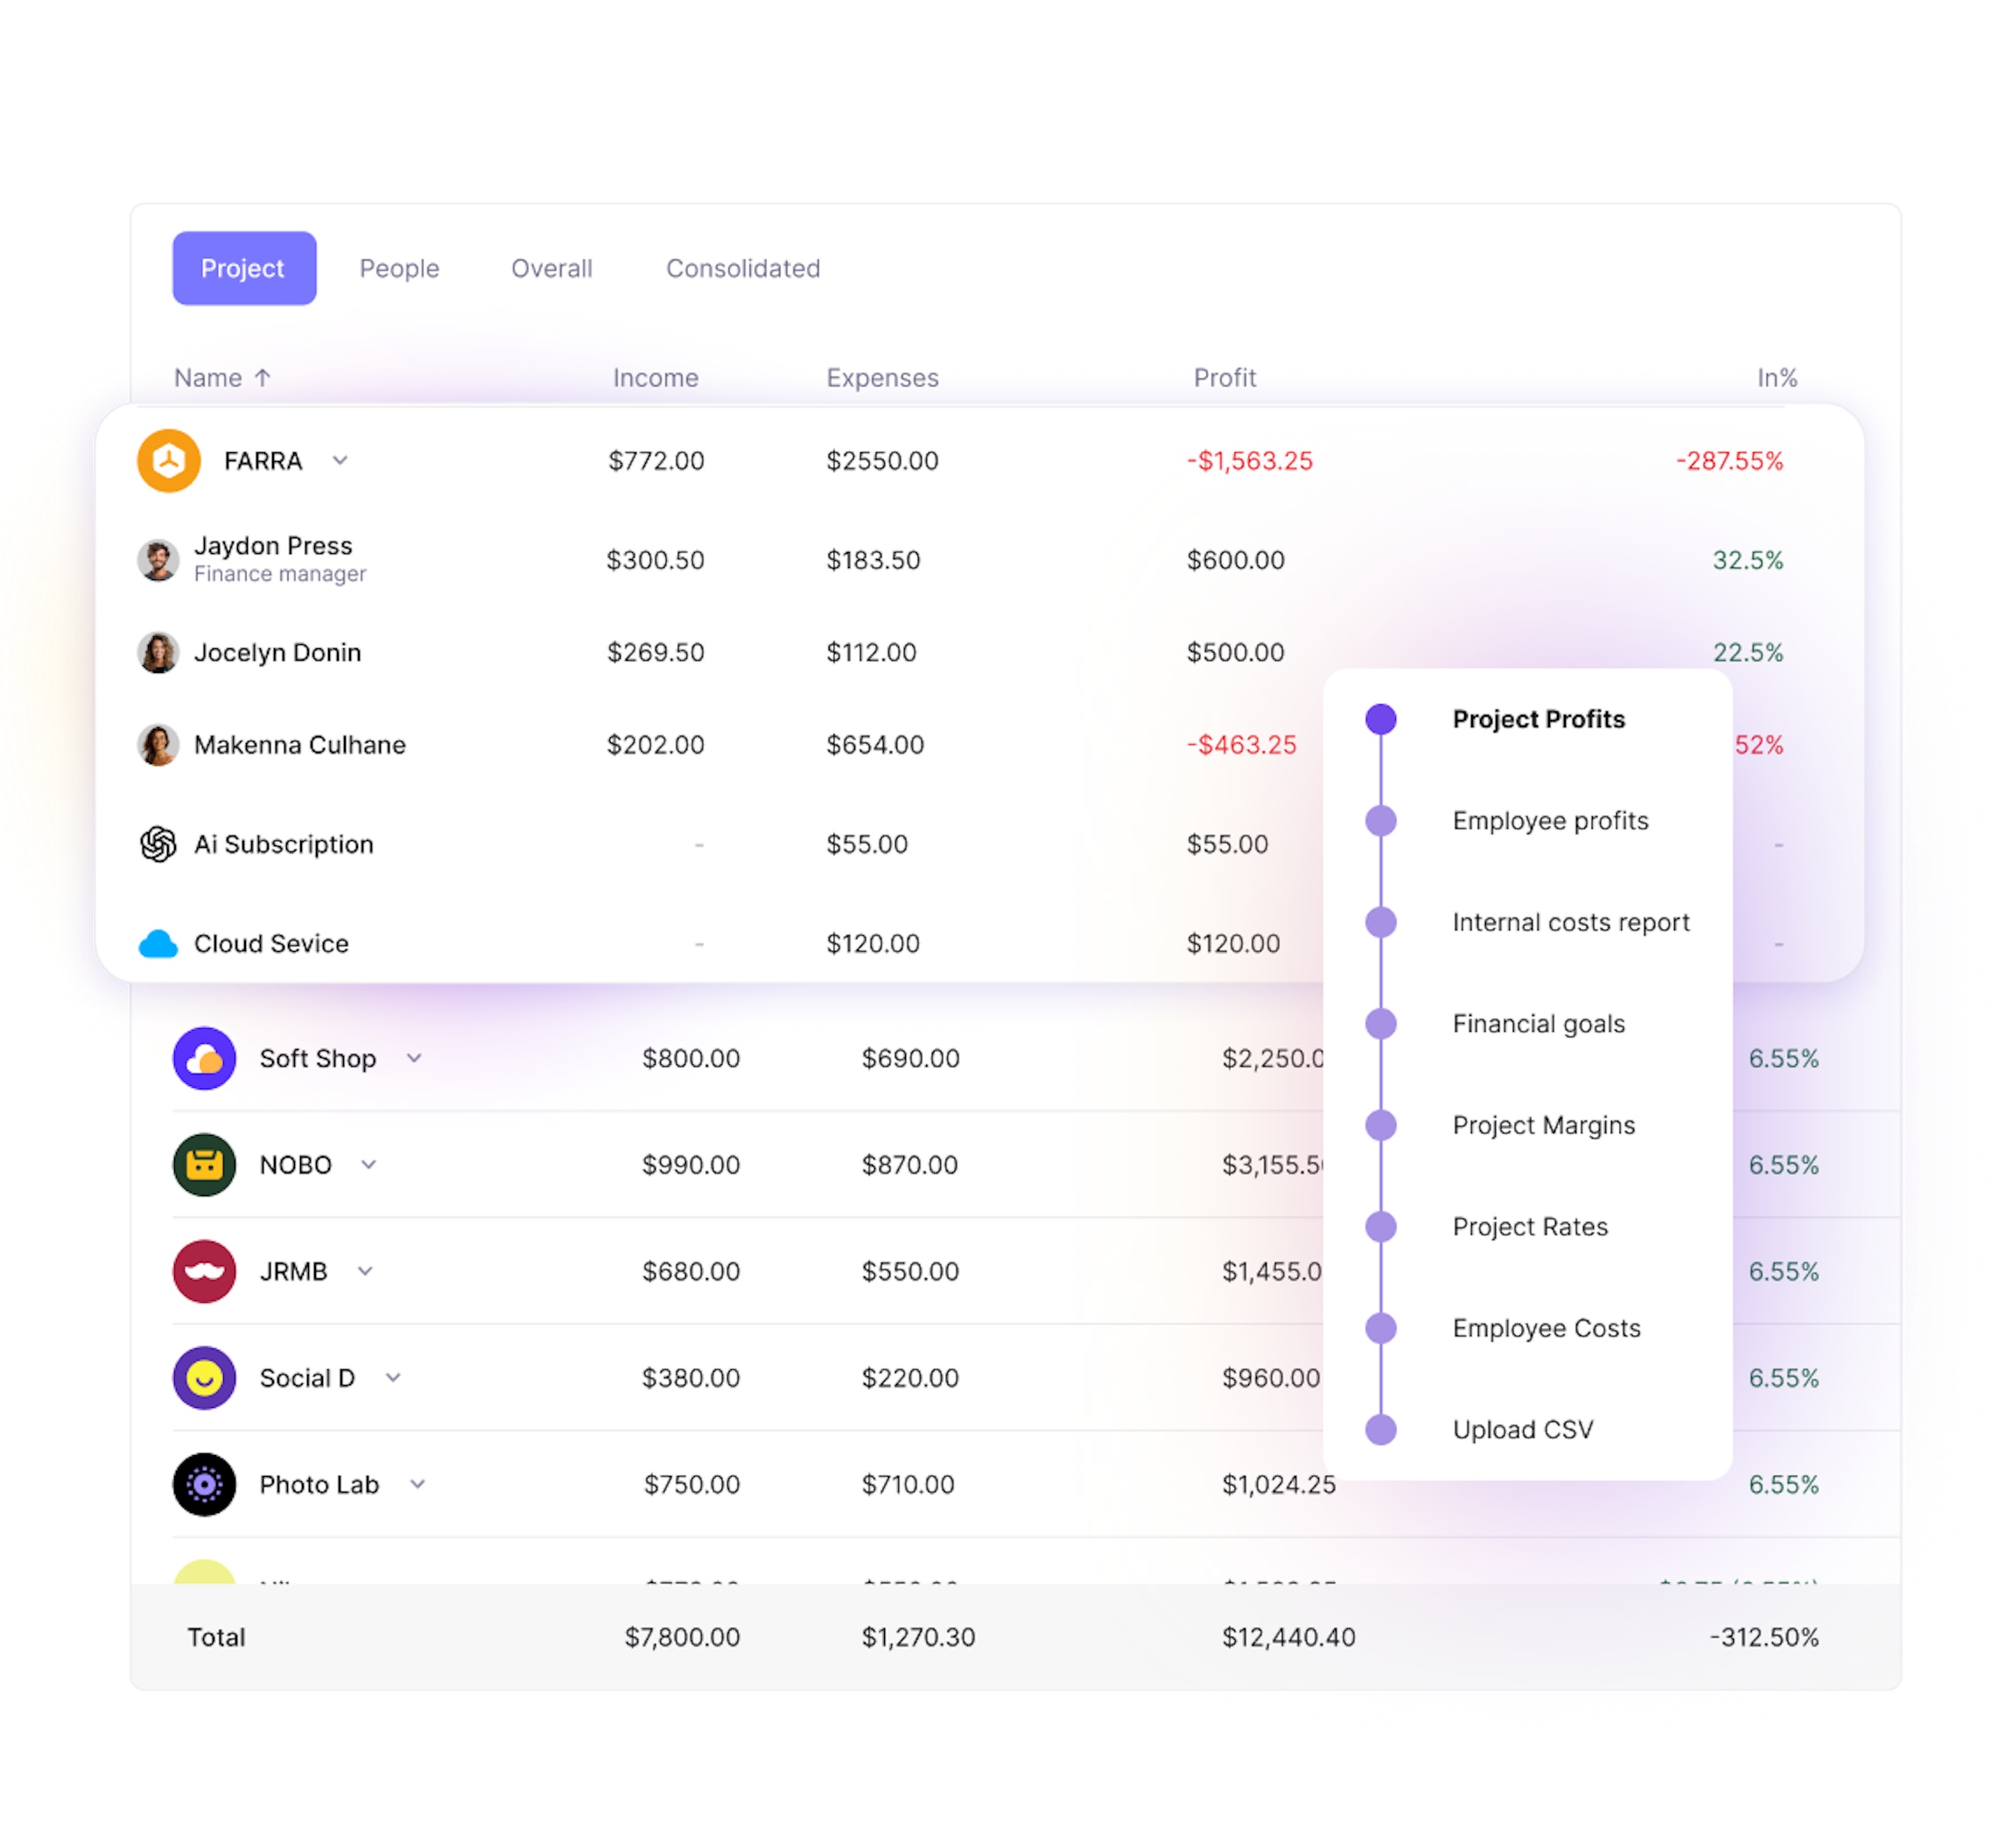
Enji calculates and displays financial slices via Worklogs, Project Margins, and Employee Profits — down to the cost of an individual feature or project, enabling more accurate strategic planning.
Together, these capabilities form Enji's executive layer: a unified context, observable delivery dynamics, and financial transparency. Next, we'll break down where visibility gaps most often appear, and which areas are critical for precise CEO/CTO/CPO decisions.
The visibility gap in engineering delivery: the blind spots that prevent CEOs, CTOs, and CPOs from making accurate decisions
When data stays scattered across multiple systems, C-level leaders end up constantly switching between tools and contexts, trying to manually assemble a single picture of what's actually happening. This increases time to insight — the time between a signal appearing and a management-level conclusion. As a result, warning signs get recognized late, and decisions become reactive, made only once consequences are already visible.
In practice, this shows up as a set of recurring blind spots:
- Risks become visible too late
Deviations rarely show up as a clear "red status" early on. Instead, they appear as subtle shifts in dynamics: cycle time stretches, review delays grow, and quality indicators degrade. - Statuses don't reflect actual delivery
A tracker captures an administrative state, but it doesn't show where the delivery chain is truly slowing down: development → review → testing → release. - Causality is missing
Executives receive explanations as retellings. Without a connected context, it's hard to separate an objective root cause from interpretation and make the right call on resources or priorities. - Development economics are estimated, not measured
Without a link between work → time → cost → outcome, it's impossible to confidently answer "how much does this cost to build?" or calculate ROI by initiatives and product directions. - No link between engineering metrics and business outcomes
Even when teams track cycle time or release velocity, these metrics often live separately from product KPIs. That makes the real connection between delivery changes and their impact on revenue, risk, or feature time-to-market harder to see. - The hidden cost of tech debt and support work
Support, incidents, fixes, infrastructure tasks, and tech debt consume a significant share of capacity, but in reporting, they often stay in the background. Tech debt grows silently, and planning becomes less accurate. - Duplicate work and cross-team misalignment
Without a single view of dependencies and load, teams solve similar problems in parallel, drift in standards, and compete for the same priorities. That slows delivery and increases the cost of change.
These are exactly the zones Enji closes through connected context (PM Agent), observability of delivery dynamics (Code Metrics), and financial breakdowns (Financial Metrics). As a result, transparency stops being a "nice to have" and becomes a management foundation: it improves decision accuracy around priorities, people, and budgets.
In this logic, Enji is an investment in controllability, not "just another tool." Next, let's expand that claim in more concrete terms.
Why an engineering management platform is an investment, not a cost line
At first glance, Enji can look like any other tool: just another line item in the budget. In practice, it's infrastructure that directly affects the quality of executive decisions around the most expensive questions: hiring, layoffs, launching new products, and prioritizing major initiatives.
Without transparency into engineering delivery, those decisions inevitably rely on averages and subjective signals. Someone says, "We don't have enough people," someone else says, "Our processes are killing speed," and proving either claim usually turns into manual evidence hunting. Enji moves the conversation into verifiable data: you can see where a team is genuinely constrained by capacity, and where the biggest losses come from work organization and tech debt.
That doesn't just help you use existing budgets more efficiently. It also helps you avoid far more expensive mistakes, from rushed cuts to greenlighting initiatives that engineering simply doesn't have the capacity or capability to deliver.
In that sense, Enji isn't "another dashboard." It's a way to reduce the cost of management errors, and at the C-suite level, those errors are measured not in thousands but in millions.
How Enji turns chaos into clarity for C-Level leaders
Enji collects and structures delivery data so that each executive sees the metrics that matter most for their role. Below is a table of the key metrics and insights Enji provides for each role, and how they support better decisions:
| ROLE | KEY METRICS AND INSIGHTS | HOW IT HELPS | |
|---|---|---|---|
| CEO | ROI, investment efficiency, portfolio progress, development cost dynamics, resource allocation by direction | Understand where value is actually created, how investments perform, and which areas require a strategic rethink | |
| CTO | Cycle time, review depth, code review wait time, release stability, technical debt, team load | Manage engineering maturity, identify bottlenecks, optimize processes, and reduce delivery risk | |
| CPO | Feature delivery speed, roadmap predictability, feature cost, quality vs speed balance, backlog health | Plan the roadmap, manage expectations, and estimate cost and time-to-market more accurately | |
Let's break this down in more detail.
Enji for CEOs: managing R&D investment as a portfolio
For a CEO, the key question is how R&D investments actually perform: where business value is being created, which initiatives are systematically "more expensive than expected," where schedule risk impacts commercial plans, and where priorities need to be reshuffled.
Enji helps move development from an "aggregated budget" view to portfolio-level controllability:
- Portfolio visibility by initiative. You can see which directions and key initiatives are progressing steadily, where deviations are accumulating, and why that matters for strategy.
- Development cost dynamics. Cost becomes observable at the project/initiative level, not only as a single total payroll number.
- Decision economics. You can compare directions by cost-to-deliver and spot where margin/efficiency is eroding before it becomes visible in the P&L.
- Reduced management lag. Questions about status, risk, and spend no longer require extra meeting cycles or manual compilation of materials.
Enji for CTOs: observability of flow and quality as a system
A CTO is typically accountable for delivery speed and quality as a system. The biggest risk at this level is managing "by gut feel" — when a problem becomes visible only after deadlines slip or quality degrades.
Enji helps CTOs keep the engineering organization inside an observable control loop:
- Flow dynamics. You can see where delays form: at the requirements intake, in review, in testing, in the release pipeline, and in cross-team dependencies.
- Early degradation signals. Shifts in cycle time, review delays, and delivery stability allow intervention before a "late surprise."
- Causality behind deviations. Connected initiative context makes it faster to answer "why did we slow down?" and "what exactly is constraining us?" without manual investigation across multiple tools.
- Business-grade justification. When the ask is "move faster" or "cut budget," the CTO can discuss trade-offs with data — where there is real slack, and where acceleration will increase risk and cost.
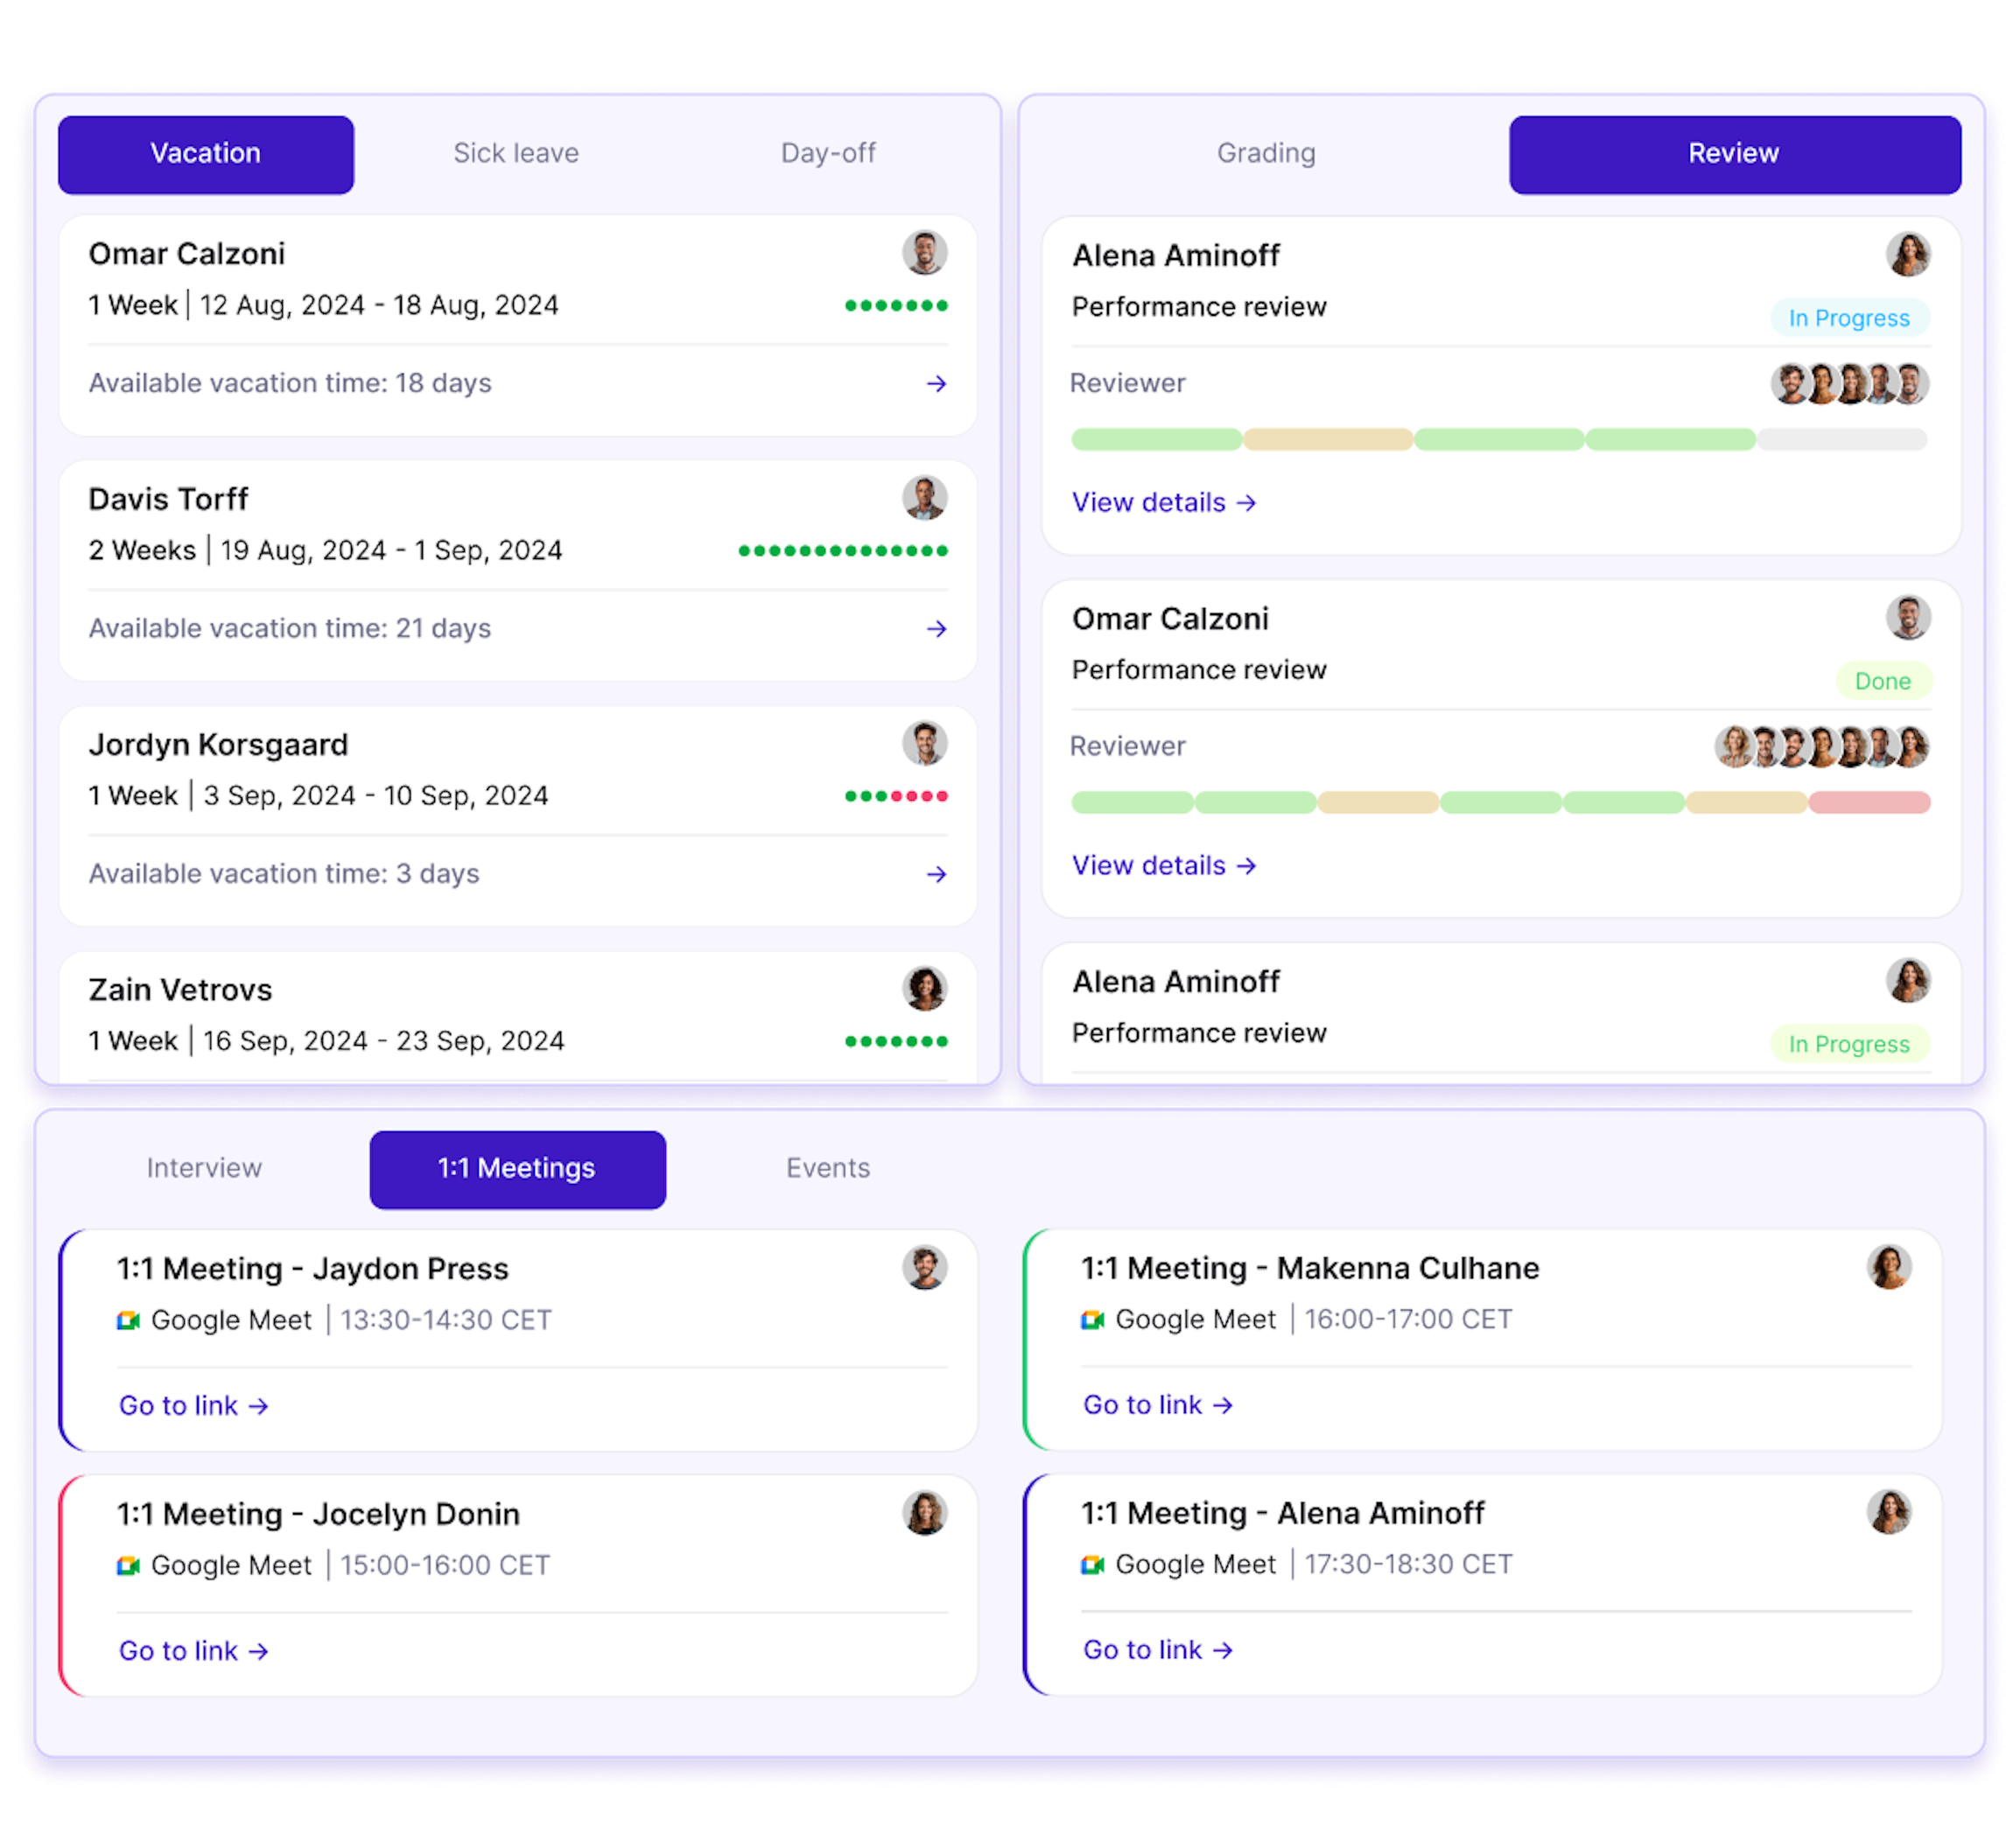
- Load and burnout risk (Employee Pulse). You can see who is operating at the limit, where overload persists for weeks, and which teams are entering a risk zone. This directly impacts delivery: sustained overload almost always leads to a slower pace and more errors.
Enji for CPOs: roadmap predictability and controllable trade-offs
For a CPO, the core pain point is the gap between the roadmap and engineering's real delivery capacity. When visibility is limited, the roadmap becomes an expectations plan rather than a controllable instrument: timelines drift, dependencies emerge late, and priorities shift become reactive.
Enji helps CPOs keep the roadmap grounded in delivery reality:
- Initiative-level predictability. You can see which initiatives are progressing steadily, where the risk of slippage is high, and what's driving it (blockers, dependencies, focus switching, delays inside the delivery pipeline).
- Cost per feature/roadmap economics. You can directly compare value vs cost and spot product areas that consume resources disproportionately.
- Quality vs speed balance. Decisions about acceleration and scope are made with a clear understanding of their implications for quality and delivery sustainability.
- Stakeholder expectation management. It's easier to justify changes in timelines and priorities when both causes and delivery dynamics are transparent.
Conclusion
Full visibility into engineering delivery is no longer a "nice-to-have." It's a prerequisite for controlled growth in modern IT businesses. Project managers can rely on classic tooling: task boards and meetings. But for CEOs, CTOs, and CPOs, that's clearly not enough. They need a single, consistent view of how the engineering organization actually operates, where time and money are being lost, and which decisions truly move outcomes.
Enji turns scattered signals from Jira, GitHub, Slack, and other systems into a clear, decision-ready picture for C-level leaders, enabling faster, more accurate decisions with lower risk. If your company already feels that engineering scale has outgrown the familiar model of "manual reporting," the next logical step is to see how Enji can deliver this new level of transparency for your team.
Book a demo to see the platform in action and verify how it supports your CEO/CTO/CPO decisions, not in slides, but on real data.