Project Management Glossary: Key Terms
Definition of Earned value management
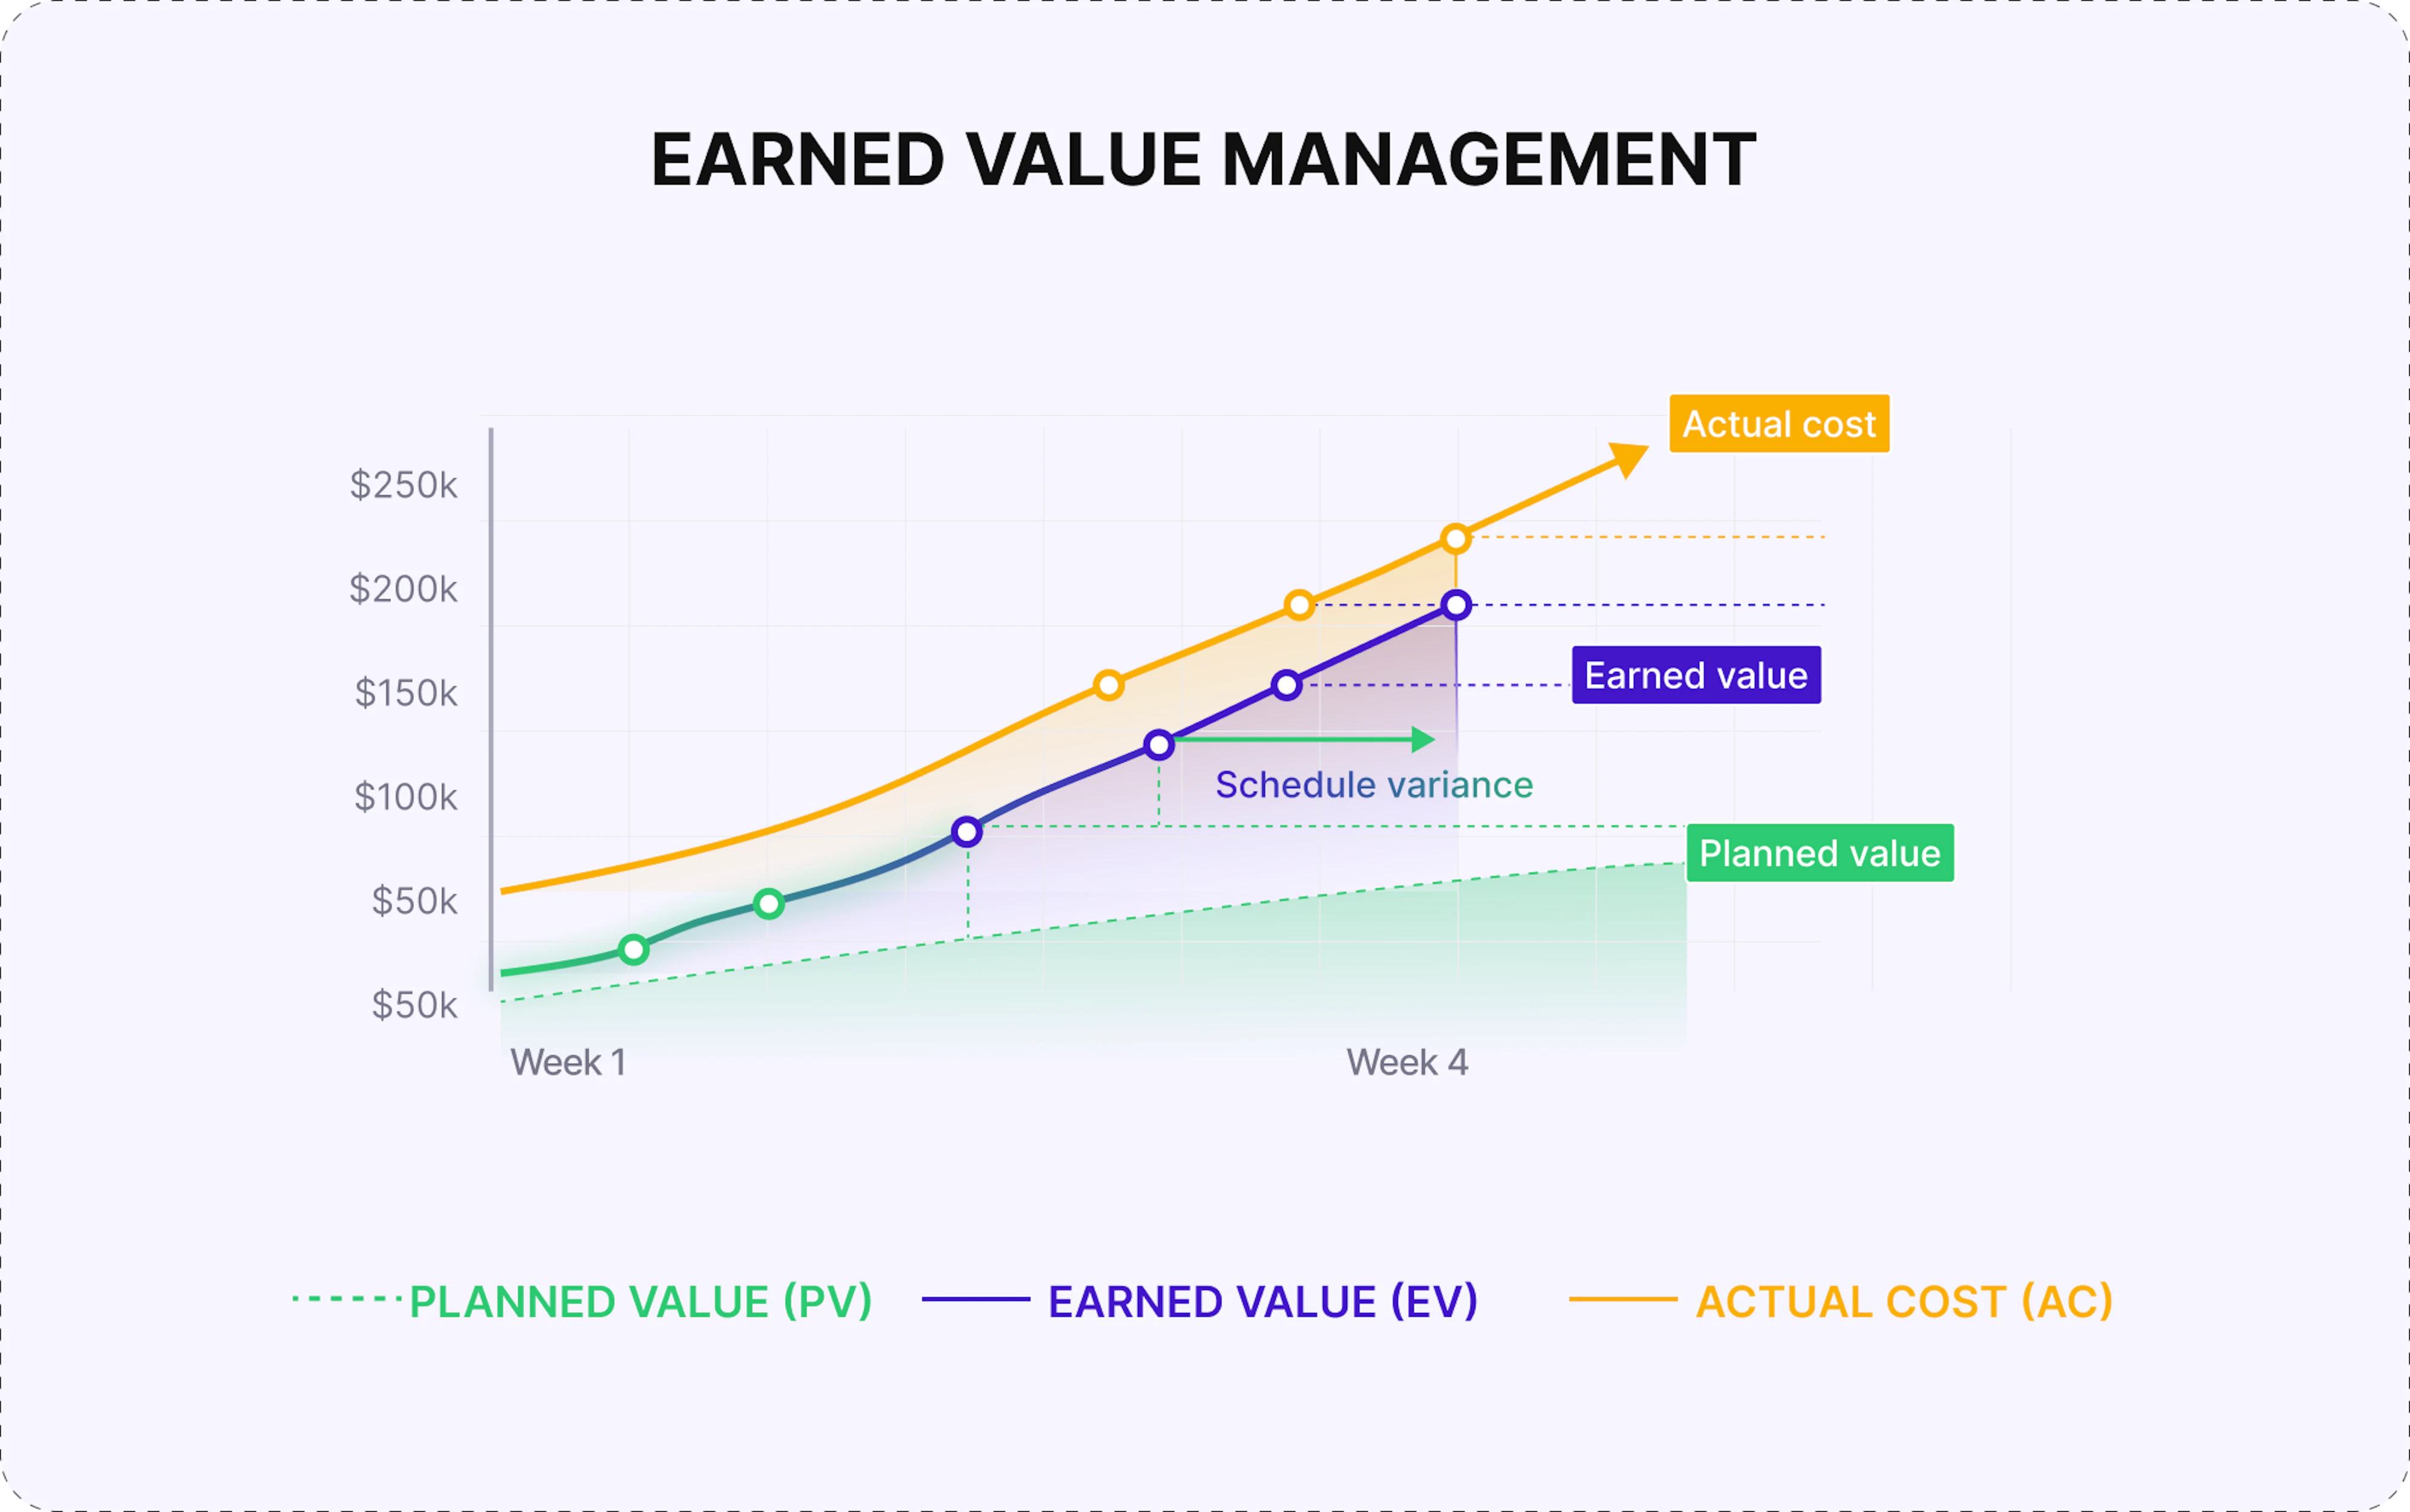
What is earned value management?
Earned value management (EVM) is a project management methodology that integrates scope, schedule, and cost to objectively assess project performance. Unlike traditional tracking, which monitors spending and timelines separately, EVM reveals whether money spent is producing proportional work completion.
EVM answers three questions: How much work was planned? How much was actually completed? How much did it cost? Its fundamental power lies in predicting future performance from current trends, transforming project management from reactive crisis response into proactive optimization.
Why is earned value management important?
EVM provides visibility and control that traditional tracking methods cannot match – and directly improves project success rates because it:
- Provides objective performance measurement: EVM eliminates the ambiguity of subjective status reports. When tasks claim "90% complete" for weeks, objective measurement reveals true progress and enables honest conversations about project health.
- Enables early problem detection: Traditional methods discover issues only after money is spent or deadlines are missed. EVM identifies performance problems at 10-20% completion when corrective action remains affordable, with early fixes costing 5-10x less.
- Supports accurate forecasting: EVM's predictive capabilities let managers project final costs and timelines based on current performance, enabling proactive decisions before crises emerge.
- Improves stakeholder communication: Simple EVM metrics communicate project health more effectively than lengthy status narratives, enabling faster strategic decisions about resource allocation and portfolios.
- Creates accountability and transparency: When performance is objectively measurable, teams and vendors operate with clear accountability. Organizations using EVM typically see significant improvement in on-time, on-budget delivery.
All of these benefits depend on three core calculations that feed everything else in the EVM framework.
How to calculate earned value management metrics?
Everything in EVM builds from three foundational metrics. Together, they feed performance indicators and forecasting calculations that turn isolated data points into comprehensive project intelligence:
The three fundamental metrics
The foundational components of EVM provide the raw data for performance analysis. These three values establish the baseline from which all other insights derive:
- Planned Value (PV) is the budgeted cost of work scheduled by a specific date, calculated by multiplying the total budget by the planned completion percentage.
Example: $500,000 project should be 40% complete → PV = $200,000 - Earned Value (EV) is the budgeted cost of work actually completed, calculated by multiplying the total budget by the actual completion percentage.
Example: Project is 35% complete → EV = $175,000 - Actual Cost (AC) is the real money spent, including labor, materials, contractors, and overhead.
Example: $190,000 spent to complete that 35% → AC = $190,000
Performance indicators
With these foundation metrics, we can calculate indicators that reveal how efficiently the project is executing right now:
Cost performance index (CPI) = EV ÷ AC measures cost efficiency.
- CPI > 1.0 = delivering more value than cost
- CPI < 1.0 = over budget
Example: $175,000 ÷ $190,000 = 0.92 (spending $1.00 to get $0.92 of value)
Schedule performance index (SPI) = EV ÷ PV measures schedule efficiency.
- SPI > 1.0 = ahead of schedule
- SPI < 1.0 = behind schedule
Example: $175,000 ÷ $200,000 = 0.88 (behind schedule)
Cost variance (CV) = EV - AC shows the dollar amount over or under budget. Negative values indicate overspending.
Example: $175,000 - $190,000 = -$15,000 (over budget)
Schedule variance (SV) = EV - PV shows the dollar value of schedule deviation. Negative values indicate delays.
Example: $175,000 - $200,000 = -$25,000 (behind schedule)
Forecasting metrics
Performance indicators reveal the current status, but forecasting metrics predict where the project will end up:
- Estimate at completion (EAC) = Budget ÷ CPI projects the final total cost based on current efficiency.
Example: $500,000 ÷ 0.92 = $543,478 (projected $43,478 overrun)
- Estimate to complete (ETC) = EAC - AC calculates the remaining budget needed.
Example: $543,478 - $190,000 = $353,478 to finish
- Variance at completion (VAC) = Budget - EAC shows the expected final overrun or saving.
Example: $500,000 - $543,478 = -$43,478 (projected overrun)
In practice, these metrics work together: you planned $200K of work (PV) but completed $175K (EV) while spending $190K (AC). You are 12% behind schedule (SPI: 0.88) and 8% over budget (CPI: 0.92). If this continues, the project will cost $543K instead of $500K – a $43K overrun you can now act on.
But knowing the formulas is only half the equation – implementing EVM consistently throughout the project lifecycle is what actually prevents overruns.
How to use earned value management?
Effective EVM implementation requires systematic application throughout the project lifecycle, not just calculating metrics.
- Establish the performance baseline: Break work into measurable tasks with clear completion criteria, assigned budgets, and scheduled timeframes. This baseline becomes the PV curve against which all progress is measured.
- Track progress at regular intervals: Measure actual work completion and costs consistently using objective criteria: "8 of 10 user stories accepted" is measurable; "90% done" is not.
- Monitor performance trends: Compute CPI, SPI, CV, and SV at each checkpoint and analyze trends over time. A CPI declining from 1.05 to 0.92 over three months signals deteriorating cost efficiency worth investigating.
- Investigate variances promptly: When metrics deviate from targets (typically CPI or SPI below 0.95), determine root causes: underestimated complexity, scope creep, productivity issues, or vendor problems. Root cause understanding enables targeted corrective action.
- Forecast and communicate proactively: Share updated EAC projections with stakeholders regularly, whether confirming a healthy trend or flagging a projected overrun with a recommended response.
- Act on insights: EVM's value lies in enabling timely intervention. Organizations that calculate EVM but do not act on it gain nothing; adjusting scope, resources, or processes is where the methodology pays off.
- Improve through retrospectives: After completion, compare EVM forecasts to actual outcomes to refine estimation accuracy and response protocols for future projects.
EVM works best when integrated into the regular project rhythm rather than treated as separate reporting overhead.
How can Enji help perform earned value management?
Enji automates EVM implementation, eliminating manual calculation overhead while providing deeper insights through AI-powered analysis. These are the main features that help teams work this way:
- Automated EV calculation and tracking
🟣 Project Margins automatically calculates EV by integrating planned work from Jira stories and epics with budget allocations and tracking actual completion in real time. Enlightening Worklogs captures actual cost by aggregating timesheets, contractor invoices, and resource allocation data, producing the AC figures needed for CPI calculations without manual spreadsheet entry. - Real-time performance dashboards
🟣 Enji displays CPI, SPI, CV, and SV alongside historical trends so managers can see at a glance whether cost performance is improving, stable, or declining. Color-coded indicators provide instant visual status, while trend charts distinguish temporary fluctuations from patterns that require intervention. - Predictive forecasting and proactive alerts
🟣 Using current CPI and SPI, Enji projects final project costs through EAC calculations and alerts managers early enough to act. For example, a $500,000 project with a CPI of 0.85 at 40% completion triggers a forecast of approximately $588,000 and a projected $88,000 overrun, while corrective options are still available. - Root cause analysis for variances
🟣 When CPI or SPI deviates from acceptable ranges, Project Narrative™ technology automatically correlates performance with project signals to identify whether the decline stems from resource inefficiency, unplanned scope, or technical complexity. This provides actionable explanations rather than just flagging a number. - Stakeholder-ready reporting
🟣PM Agent translates technical EVM data into business language, producing summaries that communicate financial health, root causes, projected overruns, and recommended actions in terms that non-technical stakeholders can act on without further interpretation.
For engineering organizations managing complex projects, Enji turns EVM from a manual calculation exercise into a continuously running intelligence system that catches problems early and supports faster, more confident decisions.
Key Takeaways
- Earned value management integrates scope, schedule, and cost to objectively measure project performance and forecast final outcomes based on current trends.
- EVM enables early problem detection when fixes cost far less, improves forecasting accuracy, strengthens stakeholder communication, and creates clear accountability across teams and vendors.
- EVM relies on three core metrics – Planned Value, Earned Value, and Actual Cost – from which performance indicators (CPI, SPI, CV, SV) and forecasting metrics (EAC, ETC, VAC) are derived.
- Effective EVM requires systematic application: establish baselines with objective completion criteria, track progress consistently, analyze trends, investigate variances, and act on insights before problems compound.
- Enji automates EVM through real-time metric calculation, performance dashboards with trend analysis, predictive forecasting with proactive alerts, root cause analysis, and stakeholder-ready reporting.


Last updated in March 2026