Project Management Glossary: Key Terms
Definition of Cost performance index
What is the cost performance index (CPI)?
Cost performance index (CPI) is a critical project management metric that measures the financial efficiency of project work by comparing the value of work completed to the actual costs incurred. It's calculated as a ratio revealing whether a project is delivering value at, above, or below the budgeted cost per unit of work.
CPI is part of earned value management (EVM), a widely adopted methodology for integrating scope, schedule, and cost measurements. Unlike simple budget tracking that only compares planned vs. actual spending, CPI accounts for work actually completed, providing a more accurate picture of financial performance. This distinction is crucial: a project can be under budget simply by falling behind schedule, but CPI reveals whether the money being spent is producing proportional value.
What does the cost performance index measure?
Cost performance index measures resource utilization efficiency throughout project execution, revealing how successfully financial investment converts into completed deliverables.
What CPI reveals
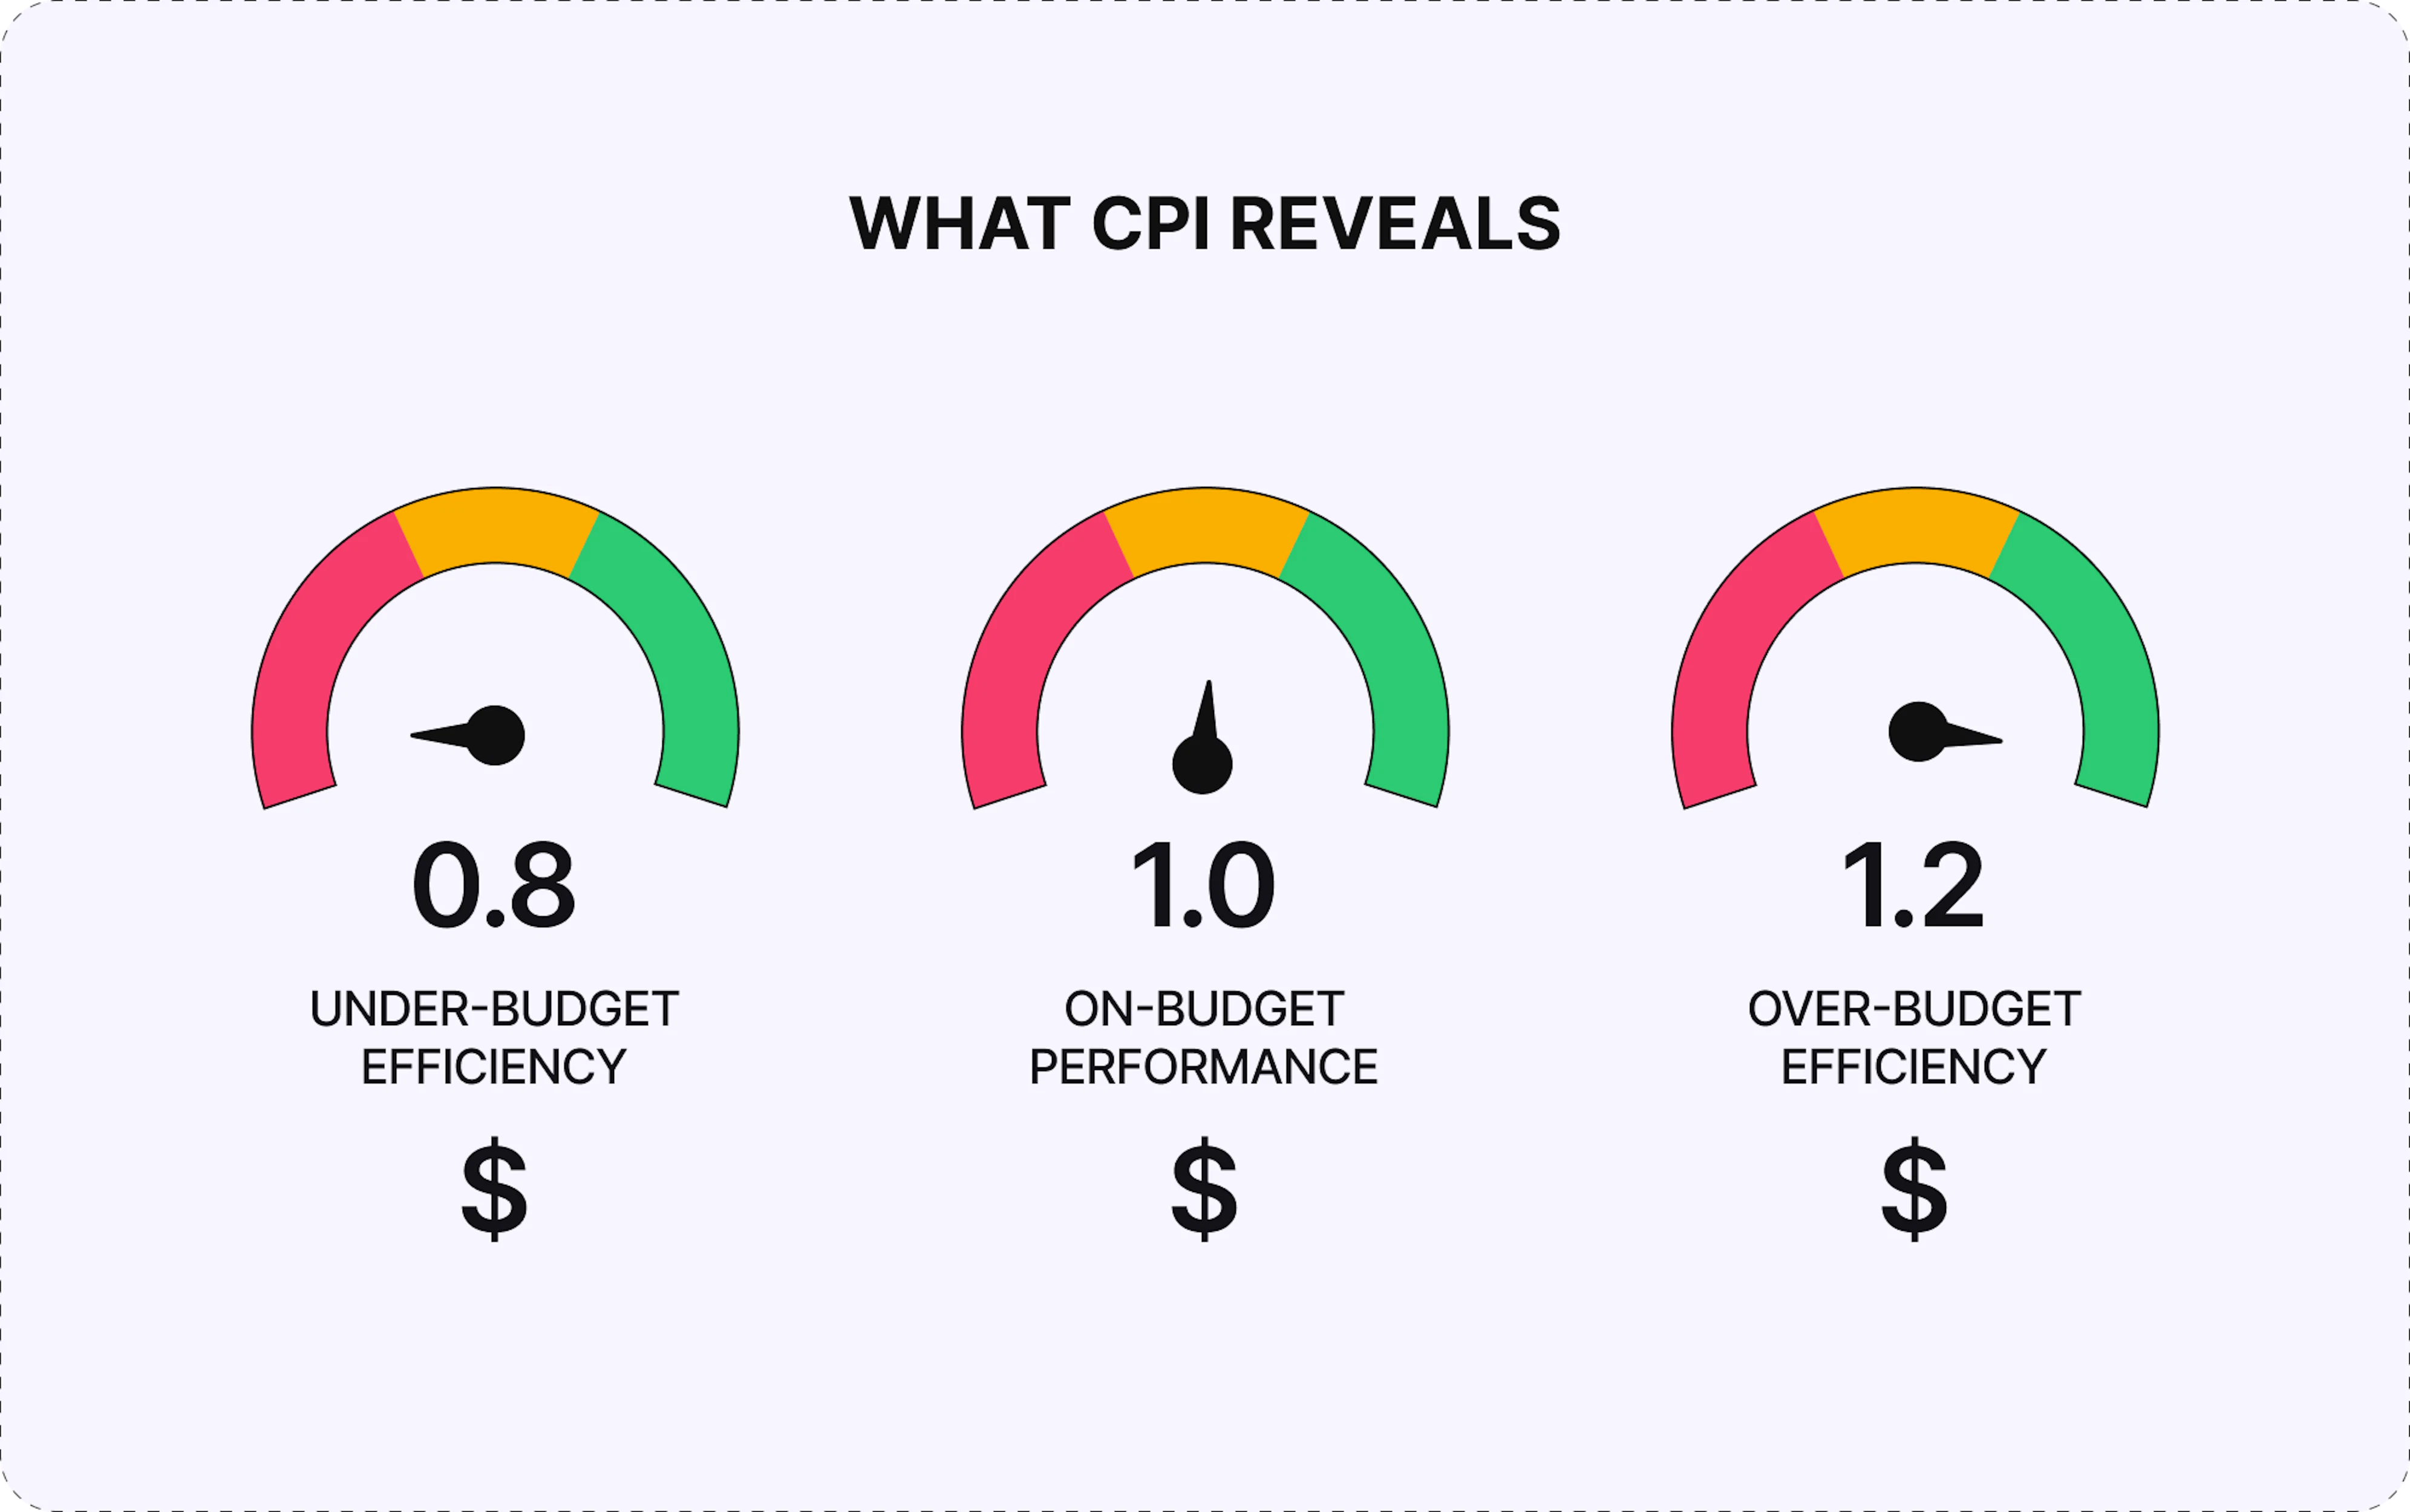
- Financial efficiency of work completion
CPI compares earned value (budgeted cost of completed work) against actual costs. If a project completes $100,000 of planned work but spends $120,000, CPI reveals the 17% efficiency loss that raw budget tracking obscures. - Project health beyond the timeline
A project ahead of schedule with a CPI of 0.75 is burning budget at an alarming rate, potentially running out of funds before completion despite timeline success. - Trend prediction for final costs
CPI provides early warnings when projects trend toward significant overruns, triggering corrective action or stakeholder communication before problems compound. - Team and vendor productivity
A team with a CPI of 1.15 consistently delivers more value per dollar than one at 0.85, informing future resource allocation and vendor selection. - Process effectiveness
If all projects using a particular methodology consistently show CPI below 0.9, the process itself may be inefficient, requiring methodology refinement rather than demanding better team performance.
What CPI doesn't measure
CPI is not a standalone success indicator. A project with excellent CPI can still fail if it:
- Delivers the wrong product
- Misses critical deadlines
- Ignores quality standards
Interpret CPI alongside schedule performance, quality metrics, and stakeholder satisfaction for a complete project health assessment.
How to calculate the cost performance index?
To calculate CPI, you only need two inputs for your chosen status date:
1. Earned value
The budgeted cost of the work that has actually been completed so far.
Often computed as:
Earned value (EV) = Percentage of work completed × Total budget
2. Actual cost
The real cost incurred to complete that work to date, including labor, materials, vendors, and overheads.
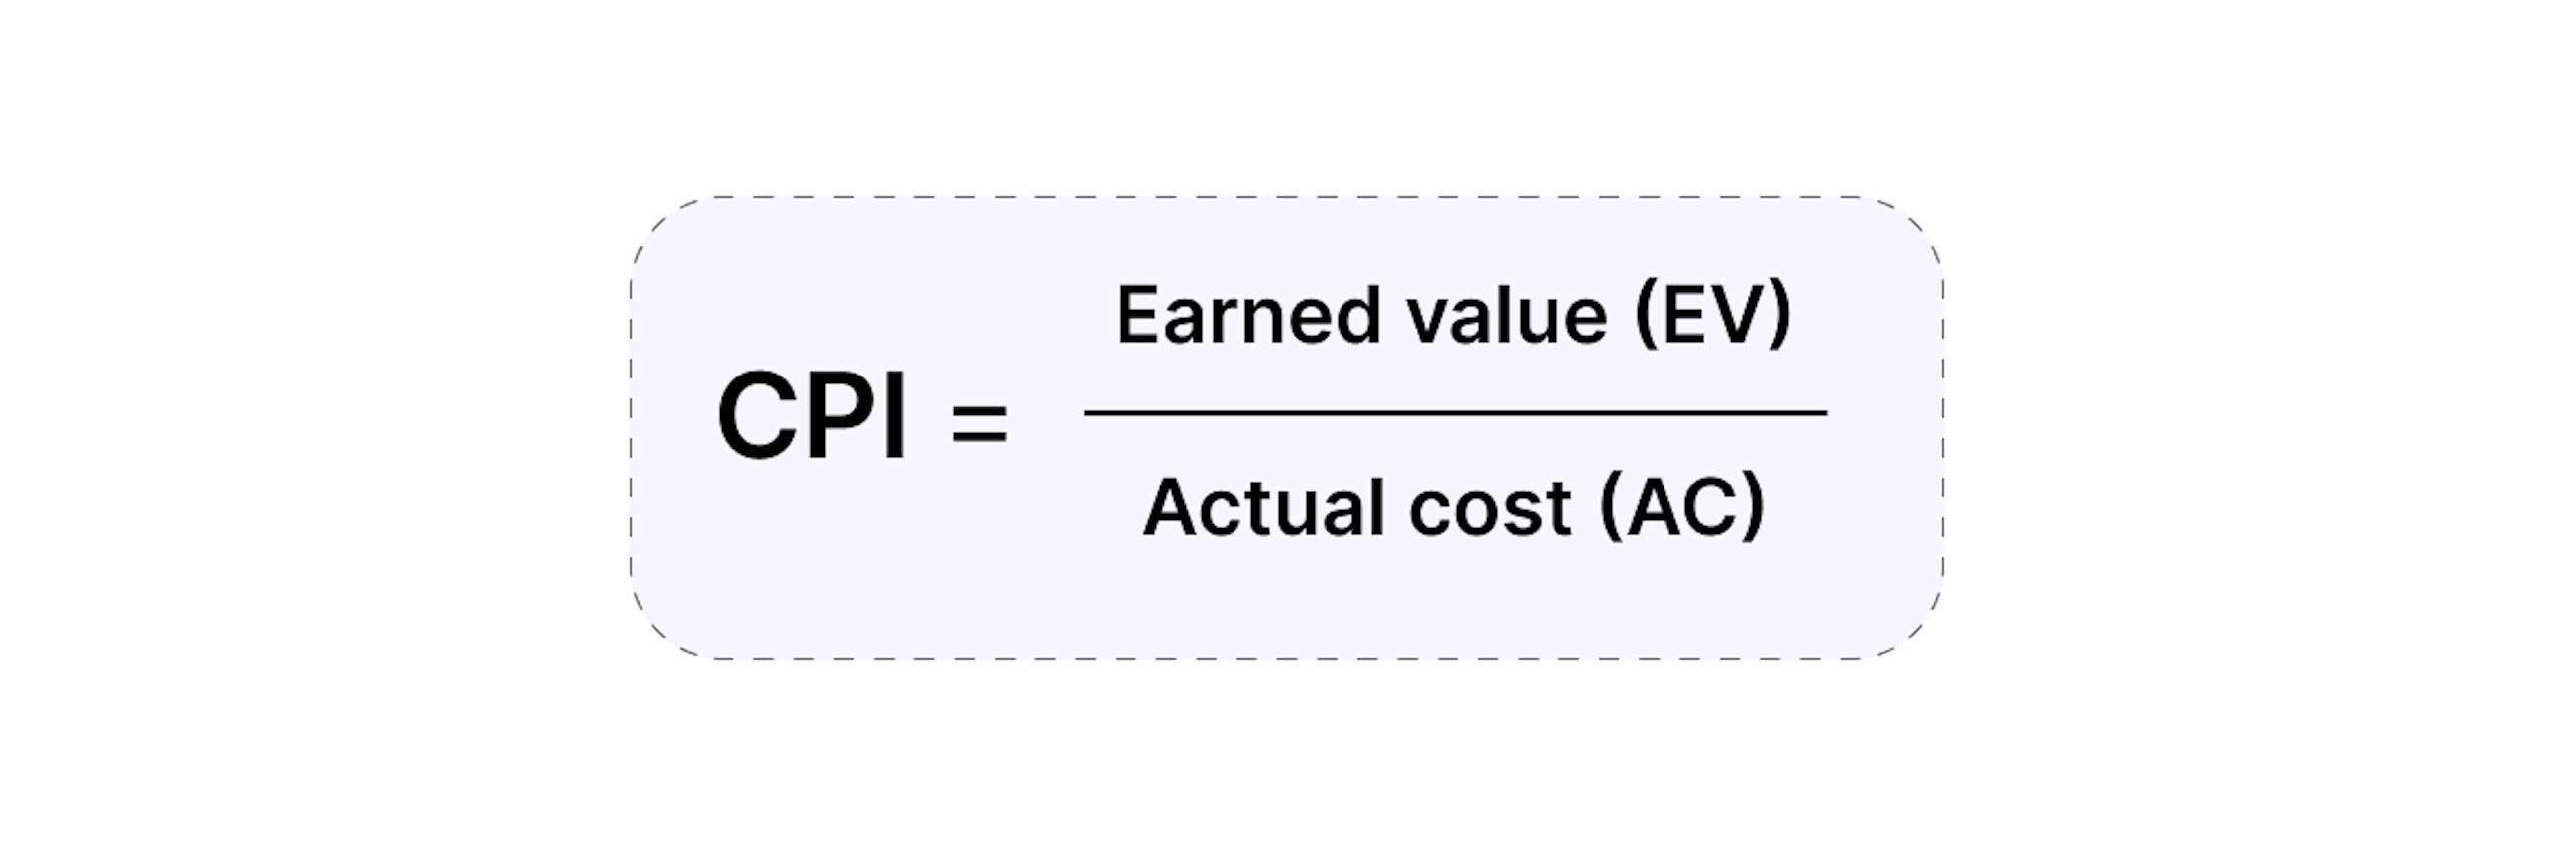
3. Apply the CPI formula
Example of calculating:
Budget for a feature: 100,000
Work completed so far: 50% → EV = 0.5 × 100,000 = 50,000
Actual cost so far: 70,000
CPI = 50,000 / 70,000 ≈ 0.71
The project is significantly over budget (only 0.71 value per 1.0 cost)
Stop assembling EV and actual cost by hand
Project Margins pulls budgets, worklogs, and delivery progress into one place and keeps CPI current without a spreadsheet.
Understanding how to calculate CPI is only half the equation: interpreting what those numbers mean for your project determines whether you can take corrective action in time.
What is a good cost performance index value?
A "good" CPI value is any value equal to or greater than 1.0, with practical nuance depending on context:
CPI slightly above 1.0 (e.g., 1.05–1.15)
- Indicates healthy cost efficiency: the project is delivering more value than it costs.
- Common in well‑estimated projects or where teams find smarter ways to deliver.
CPI close to 1.0 (0.95–1.05)
- Usually acceptable; small deviations are normal and may even out over time.
- Many organizations treat this band as “on budget” in practice.
CPI significantly below 1.0 (e.g., < 0.9)
- Indicates meaningful overspend relative to value delivered.
- Should trigger an investigation into causes (scope creep, underestimation, productivity issues, unexpected complexity).
For long‑running or high‑risk projects, a good cost performance index is typically anything at or above 1.0, sustained over time with limited volatility. The key is not just hitting 1.0 once, but keeping CPI stable while still delivering the planned scope and quality.
How does Enji help track and improve CPI?
Enji provides comprehensive CPI monitoring and optimization through automated tracking, predictive analytics, and actionable intelligence that transforms cost performance management from retrospective accounting into proactive financial control.
- Real-time earned value calculation
The Project Margins feature automatically calculates Earned Value by linking Jira data with budgets and progress, offering live CPI updates without manual input. - Financial transparency for stakeholder communication
PM Agent translates CPI data into executive-friendly reports with clear ROI insights and recommendations for budget alignment. - Automated actual cost tracking
Enlightening Worklogs and cost integrations convert timesheets, invoices, and resource data into accurate Actual Cost figures for direct CPI analysis. - Live dashboards and trend analysis
Enji's real-time dashboards visualize CPI status and trends with color-coded indicators and historical comparisons for quick financial assessment. - Predictive cost forecasting
Using CPI-based Estimate at Completion (EAC), Enji projects final costs early, identifying likely overruns and enabling timely corrective actions. - Variance and root cause analysis
Project Narrative™ technology pinpoints CPI deviations caused by inefficiency, scope creep, or technical challenges, guiding targeted improvement. - Proactive monitoring and pattern detection
Employee Pulse and Routine Alerts detect workload or capacity issues affecting CPI, supporting early intervention.
Enji's CPI tracking reports financial performance while enabling proactive management that prevents budget crises, improves estimation accuracy, and builds stakeholder trust through transparent, data-driven communication.
Key Takeaways
- Cost performance index (CPI) measures financial efficiency by comparing earned value (budgeted work) to actual costs, showing whether a project delivers expected value per dollar spent.
- CPI reflects resource efficiency, supports cost forecasting, and highlights productivity trends, but should be viewed alongside schedule, quality, and satisfaction metrics for full context.
- The formula of CPI is Earned Value ÷ Actual Cost. Values of 0.95-1.05 indicate healthy performance; above 1.05 shows cost efficiency, and below 0.85 signals serious budget risk.
- Ideal CPI varies by industry and project type – 0.90-1.00 is typical for R&D, 0.95–1.05 for construction. The best reference is your organization’s own historical data.
- Enji tracks CPI automatically through real-time EV calculation, cost integration, live dashboards, predictive forecasting, variance analysis, and proactive alerts.
- Enji's Project Margins and Project Narrative™ technogy turn CPI data into clear business insights, identify high-performing patterns, and improve forecasting accuracy across projects.

Last updated in July 2026