Performance Measurement Glossary: Key Terms
Definition of KPI report
What is a KPI report?
A KPI report is a structured document that tracks, visualizes, and communicates key performance indicators, transforming raw performance data into actionable insights that inform decision-making, resource allocation, and strategic adjustments.
Unlike general analytics reports that may cover hundreds of metrics, KPI reports focus on the vital few indicators directly tied to success criteria: deployment frequency, sprint velocity, or defect density for engineering teams, revenue per engineer or time-to-market for business stakeholders. A well-designed KPI report answers three questions:
- Are we on track?
- Where are we falling short?
- What corrective actions should we take?
Why are KPI reports important for a project?
Benchmark research from PM Solutions on project management maturity from PM Solutions shows that organizations with more advanced, KPI‑driven practices see roughly 30% fewer failed projects and significantly more projects delivered ahead of schedule, compared to low‑maturity peers. This is why organizations rely on KPI reports for the following advantages:
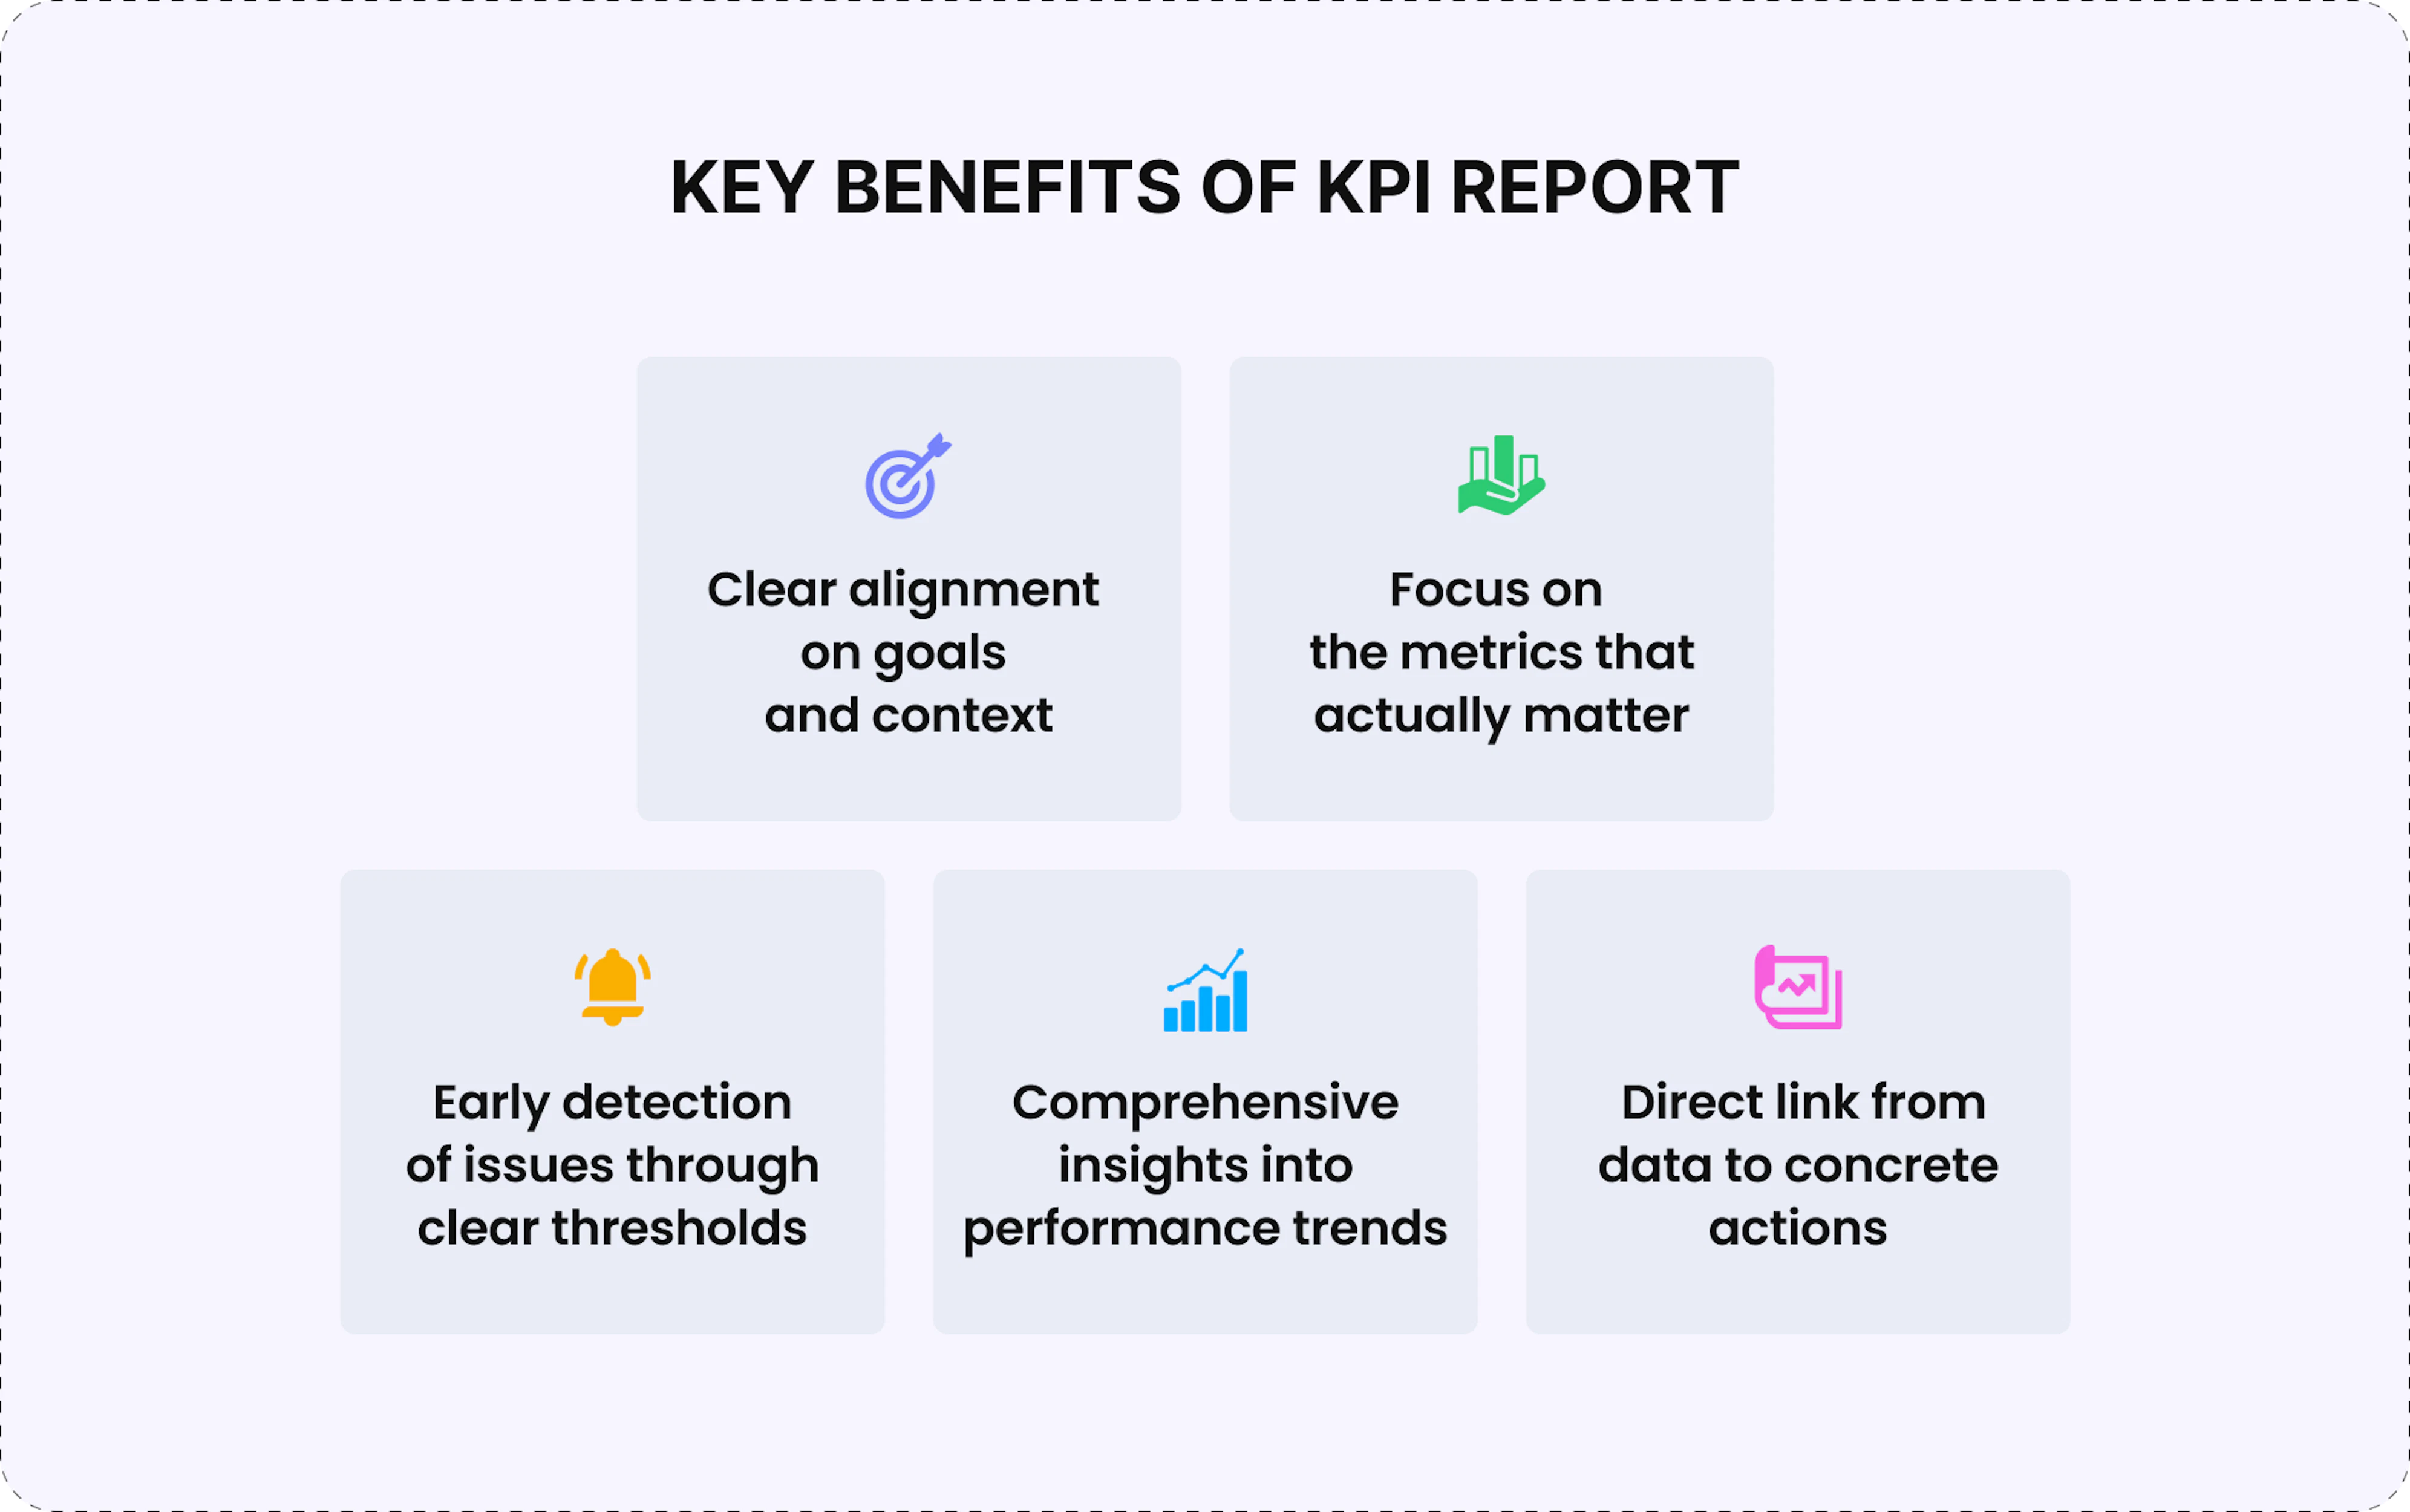
- Alignment with goals and context
Reports keep everyone synchronized on what the project is trying to achieve and over which timeframe, reducing misaligned expectations and conflicting priorities across teams. - Focus on metrics that matter
By forcing deliberate selection of a small KPI set, reports direct attention to indicators most closely tied to success across delivery, quality, productivity, and cost, preventing teams from drowning in disconnected data. - Early detection through clear thresholds
Red/amber/green indicators make it immediately obvious when something drifts off course, so stakeholders can spot issues before deadlines or budgets are missed. - Performance trends over isolated snapshots
Charts and trend descriptions (improving, stable, deteriorating) with notes on what changed, such as "cycle time increased after scope expansion," help teams distinguish temporary noise from structural problems. - Direct link from data to action
Effective KPI reports include specific next steps, turning measurement from passive documentation into an active management tool that drives continuous improvement.
In summary, disciplined KPI definition, tracking, and follow‑up action turn project management from reactive fire‑fighting into proactive performance optimization.
What are the key components of a KPI report?
Effective KPI reports balance comprehensiveness with clarity, providing sufficient detail for informed decisions without overwhelming readers with data noise. That's why they focus on a limited set of core components, including:
- Context – Reporting period, project or team name, report date, and intended audience. Stakeholder needs vary: executives need high-level outcomes while teams need operational details.
- Executive summary – Overall project health distilled into a concise paragraph or RAG status indicator, allowing busy executives to assess severity before reviewing details.
- Individual KPI metrics – Each KPI should include the metric name, current value, target for comparison, trend direction, and time period covered. For example: "Sprint Velocity: 32 story points (target: 35), down from 38 last sprint, 3-sprint average: 35 points."
- Visualization and trend analysis – Line charts and bar charts make patterns immediately apparent, revealing whether current performance is a temporary fluctuation or a sustained trend.
- Commentary and interpretation – The "why" behind numbers. If cycle time increased 40%, commentary might note: "Spike attributed to complex security requirements added mid-sprint, requiring additional code review rounds."
- Risk flags and alerts – Highlighted KPIs that crossed critical thresholds, ensuring decision-makers notice areas requiring intervention.
- Action items and recommendations – Specific next steps such as "reduce WIP on Team B" or "re-scope Feature X for the next release," demonstrating that monitoring serves a purpose beyond documentation.
- Comparative context – Performance relative to benchmarks or historical baselines, which transforms abstract numbers into meaningful assessments.
Together, these components create KPI reports that inform, guide, and drive continuous improvement rather than simply documenting historical performance.
What are the best practices for effective KPI reports?
Creating KPI reports that drive real improvements requires strategic design and disciplined execution. Here are industry-proven practices:
1. Form a strategic foundation
◽ Select 5-10 critical metrics that directly influence decisions, balancing speed (velocity, cycle time), quality (defect density, test coverage), and business impact (delivered value, satisfaction). If a metric doesn't drive action, it's noise.
◽ Define three threshold levels for each KPI – target, acceptable, and critical – to create accountability. KPIs without targets are just interesting facts.
2. Focus on execution excellence
◽ Maintain consistent reporting cadence: operational KPIs weekly, strategic indicators monthly. Irregular reporting undermines credibility and makes trend analysis unreliable.
◽ Tailor reports to the audience: developers need granular technical metrics, product managers need feature-level progress, and executives need portfolio-level summaries. Create multiple views from the same data rather than forcing identical reports on everyone.
3. Work on adequate technical implementation
◽ Automate data collection wherever possible. Manual compilation is error-prone, time-consuming, and delays insights. Modern platforms pull from Jira, GitHub, and other sources automatically.
◽ Emphasize 3-month trend views for strategic metrics over single data points, making it clear whether performance is improving, stable, or declining.
4. Follow quality and evolution
◽ Be transparent about data limitations or known biases to maintain trust and prevent decisions based on flawed assumptions.
◽ Review KPI selection quarterly as projects evolve. Retire irrelevant metrics and introduce new ones to stay aligned with current objectives.
Organizations that follow these practices transform KPI reporting from a compliance exercise into a strategic asset – one that benefits greatly from automation to reduce manual effort and ensure reliable performance tracking over time.
How to automate KPI reporting with Enji?
Manual KPI compilation drains management time while producing outdated, error-prone reports. Enji transforms KPI tracking from spreadsheet maintenance into automated intelligence that drives faster, smarter decisions:
- KPI reports always reflect current reality rather than stale snapshots thanks to multi-source integration that continuously collects performance data from all connected tools, removing hours of manual extraction from Jira, GitHub, Slack, and other platforms.
- PM Agent can be configured with scheduled tasks to automatically generate and distribute comprehensive project reports at regular intervals, so stakeholders receive consistent intelligence without requesting it while managers focus on strategic decisions.
- Team Code Metrics provides automatically generated dashboards tracking velocity, cycle time, deployment frequency, lead time, and code quality metrics, eliminating weeks of custom framework design while aligning with industry best practices.
- Intelligent dashboards present KPIs through trend lines, progress bars, and comparison charts rather than dense spreadsheets, making patterns instantly apparent and giving each role a relevant view without parsing raw data.
- Summarizer generates concise reports on task activities, worklogs, code metrics, and project health in minutes, aggregating data from multiple sources into ready-to-share narratives that eliminate interpretation overhead and keep leadership informed.
- Project Margins uniquely combines technical KPIs with financial metrics, showing delivery velocity alongside cost per feature, budget burn rate, and profitability trends – giving leadership the complete picture needed for strategic resource allocation decisions.
For engineering organizations where timely, accurate KPI visibility determines project success, Enji transforms reporting from time-consuming compliance work into automated strategic intelligence that drives continuous improvement.
Key Takeaways
- A KPI report tracks the vital few performance indicators tied to project success, transforming raw data into actionable insights for strategic decisions and course corrections.
- KPI reports maintain alignment, enable early problem detection, support data-driven decisions, and drive continuous improvement across projects.
- Key components include executive status summaries, individual metrics with targets and trends, visualizations, contextual commentary, risk flags, and actionable recommendations.
- Best practices: select 5-10 critical KPIs, define clear thresholds, maintain a consistent reporting cadence, tailor reports to the audience, automate data collection, and review KPI selection quarterly.
- Enji automates KPI reporting through multi-source integration, intelligent dashboards, PM Agent summaries, and scheduled delivery – eliminating manual effort while improving accuracy and timeliness.

Last updated in March 2026