Project and Individual Code Metrics
Enji collects performance metrics based on data from repositories and task trackers to give users insights into a team's efficiency on projects and analyze each developer's productivity.
Project Metrics
To start displaying these metrics, link a repository to the project. For more information, see Repositories.
Work In Progress
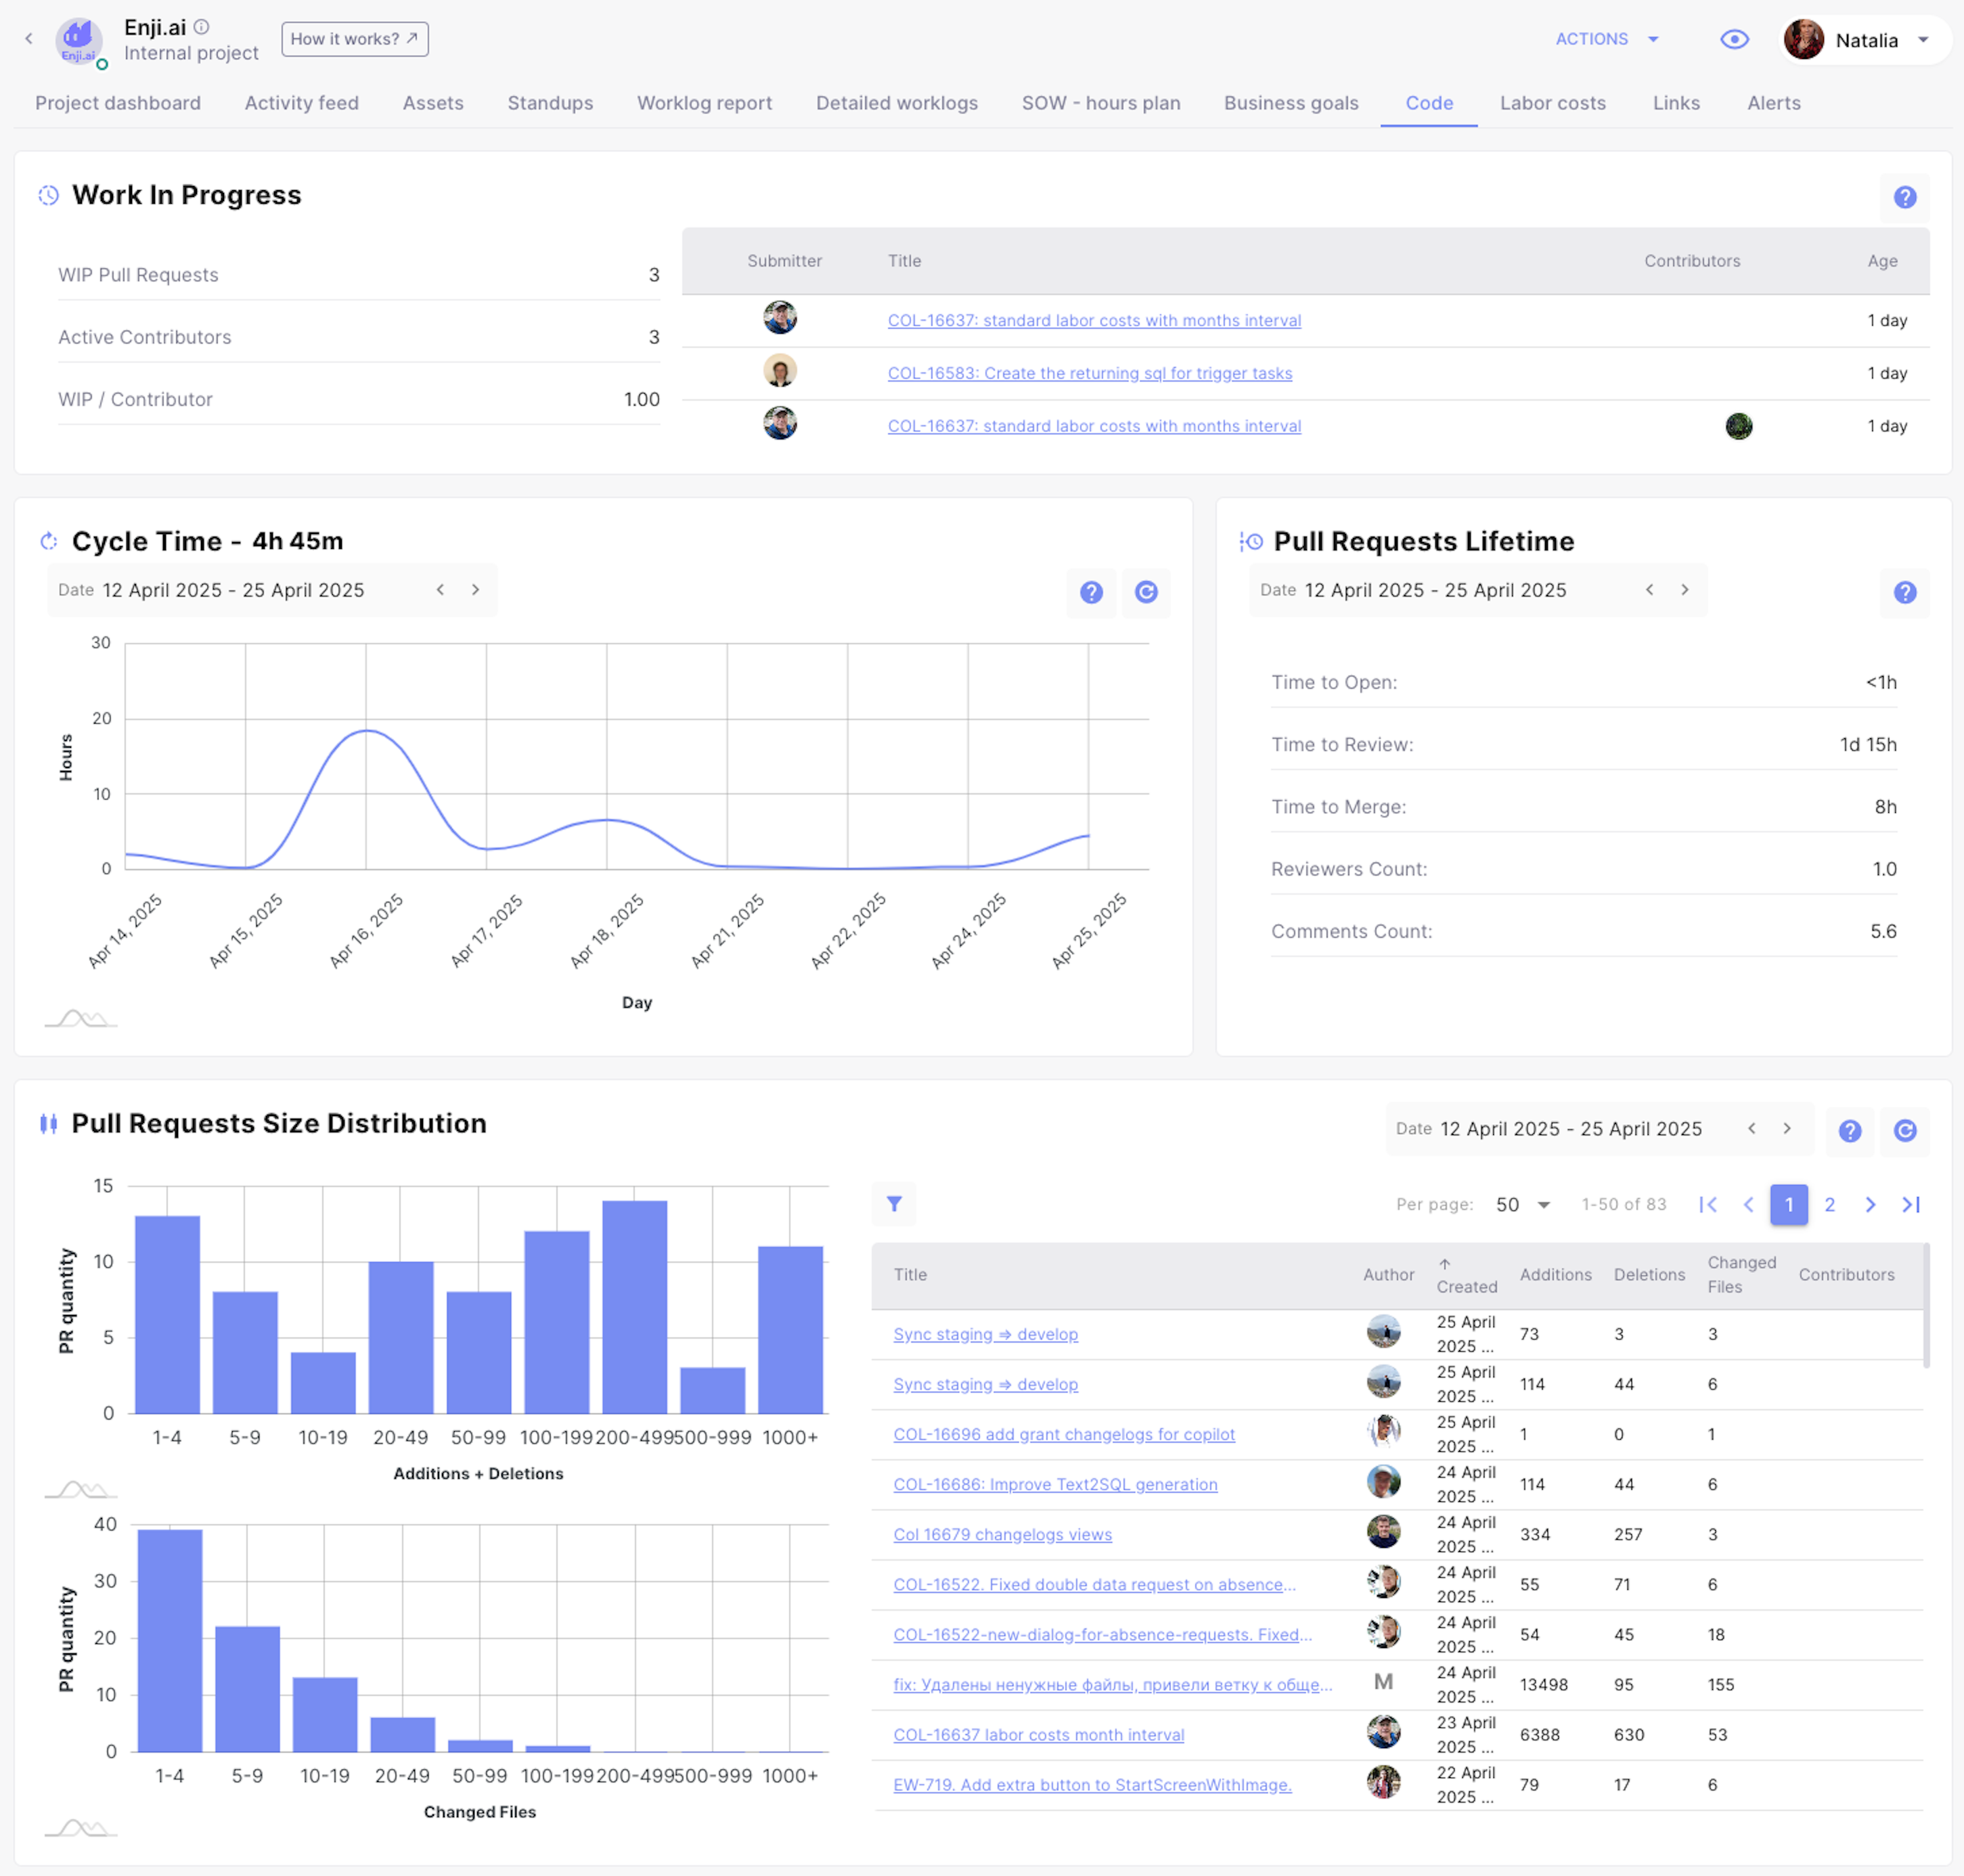
The "Work In Progress" widget provides an overview of the ongoing work on a project. Enji collects all open PRs for the last 3 days from all repositories linked to the designated project. Then, Enji calculates the number of open PRs, the number of active participants, and the ratio of PRs in progress to active participants. These metrics are displayed in the widget to provide real-time insights into a project's progress.
Key metrics include:
- WIP Pull Requests – Shows the number of open pull requests (PRs).
- Active Contributors – The number of people commenting or making changes to PRs.
- WIP/Contributor – The ratio of PRs in progress to the number of active participants.
- WIP PR Table – This table provides detailed information about each PR in progress. It includes the PR submitter, the PR title (with a link to the PR page), contributors, and the PR’s age (categorized as less than 1 day, 1 day, 2 days, or 3 days).
Cycle Time
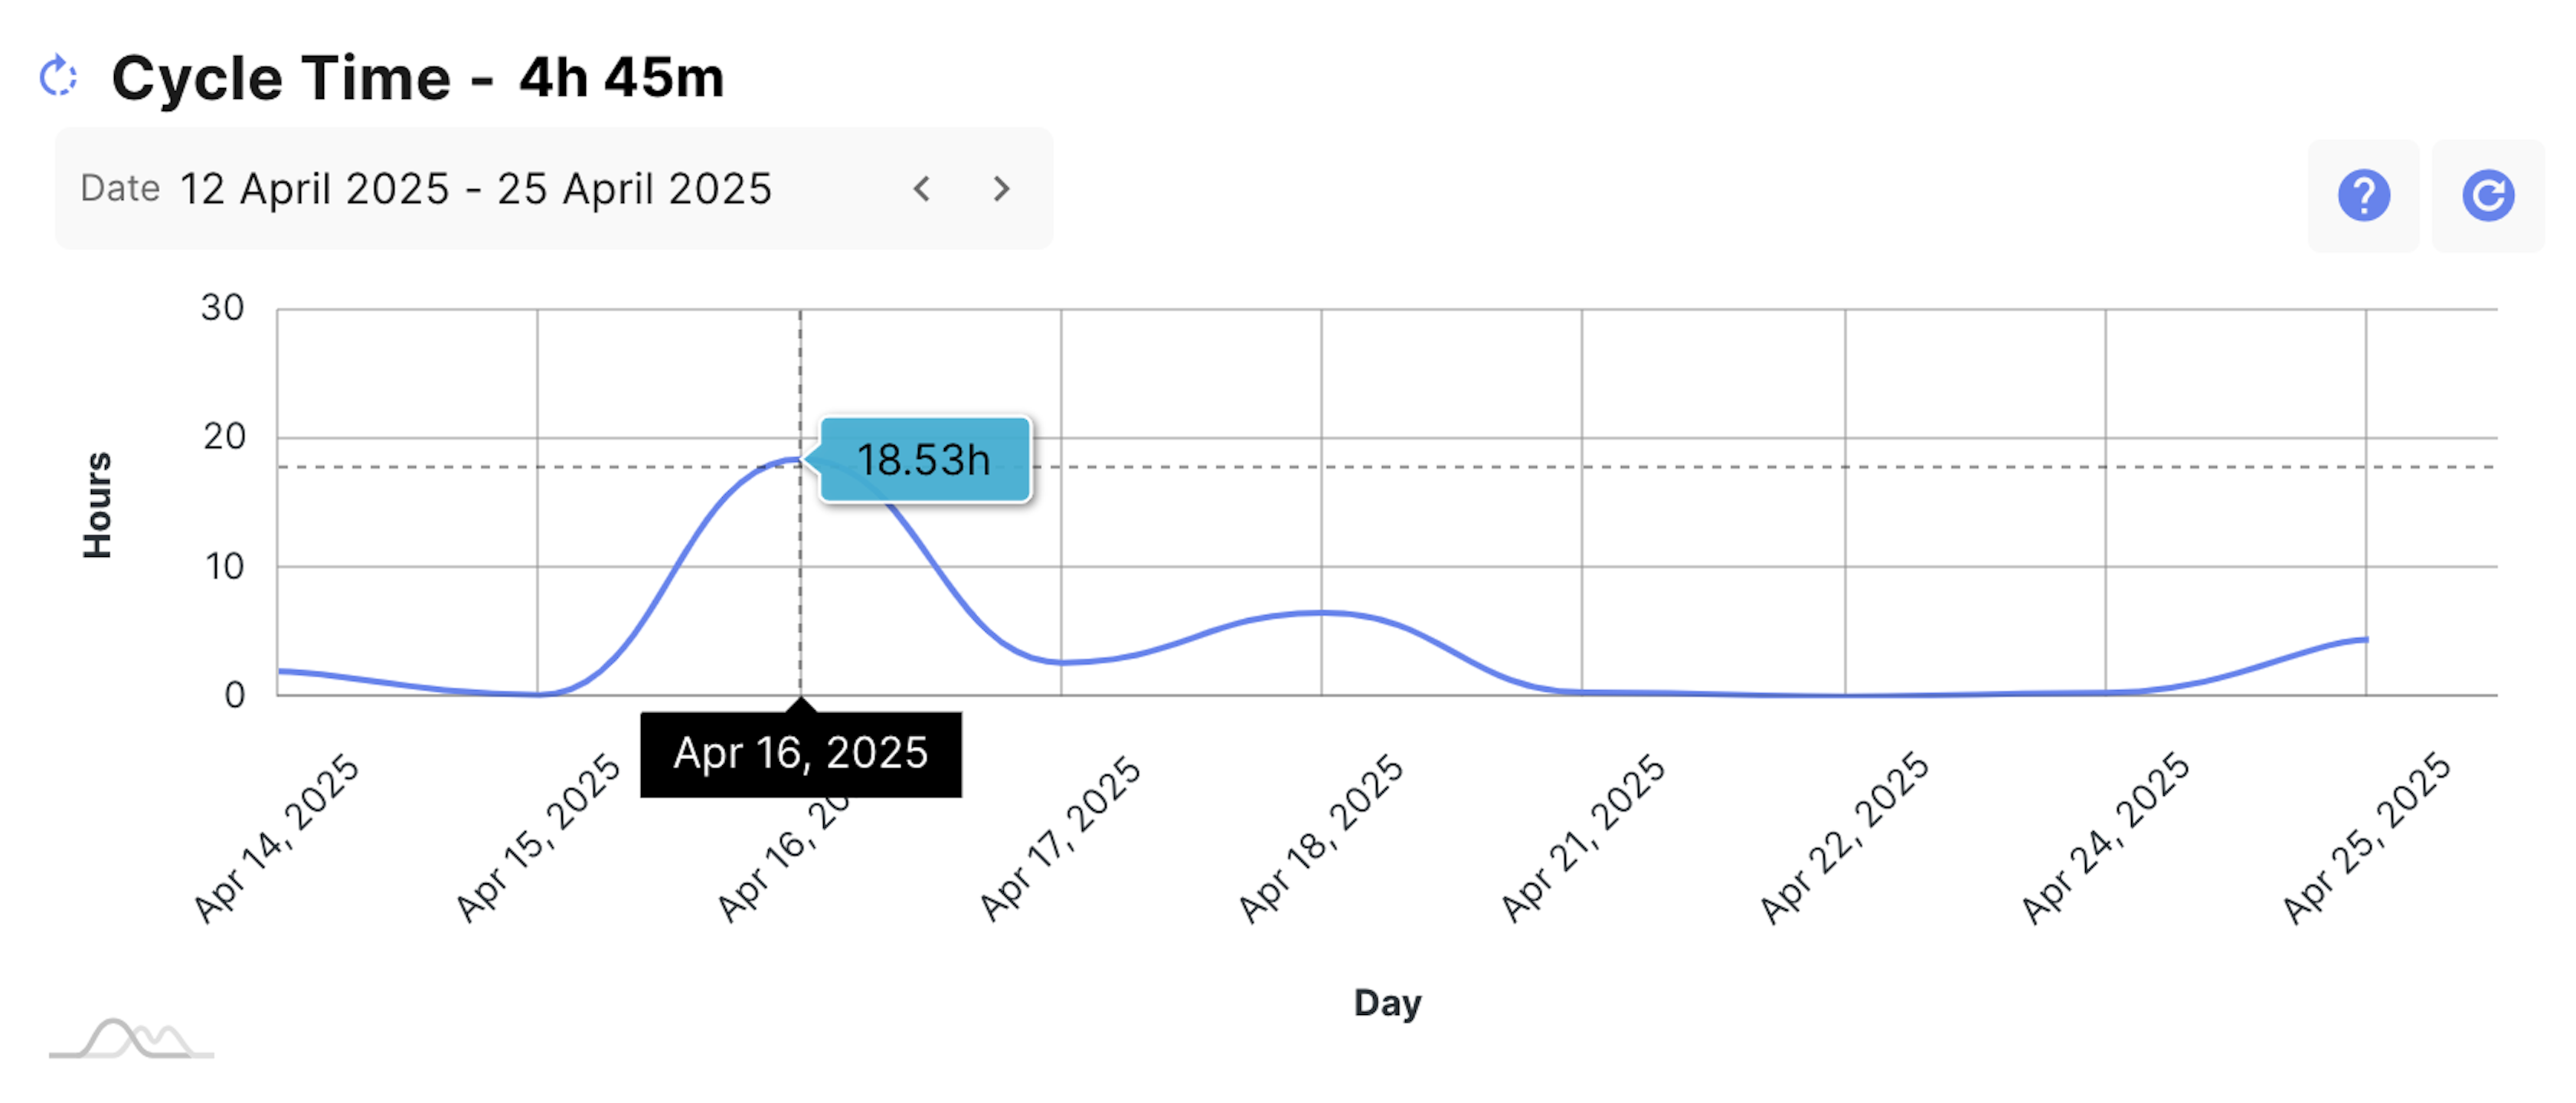
The "PR Cycle Time" widget provides insights into how efficiently a team processes Pull Requests (PRs). It helps managers understand the average time spent on PRs. Enji collects PRs from all repositories linked to a project and measures the time from the first commit to the merge or closure of each PR. Then, Enji calculates the average cycle time for each day and the total cycle time for the selected period.
Key metrics include:
- Hours – The total cycle time in "hours." This represents the average cycle time for all PRs over the selected period.
- Date – Use this filter to select a specific period. By default, it is set to the last two weeks.
- Line Chart – This chart illustrates the changes in cycle time over the selected period. Each value shows the time from the first commit to the merge or closure of PRs on a specific day. Values exceeding 100 hours are highlighted in red for easier identification.
Pull Requests Lifetime
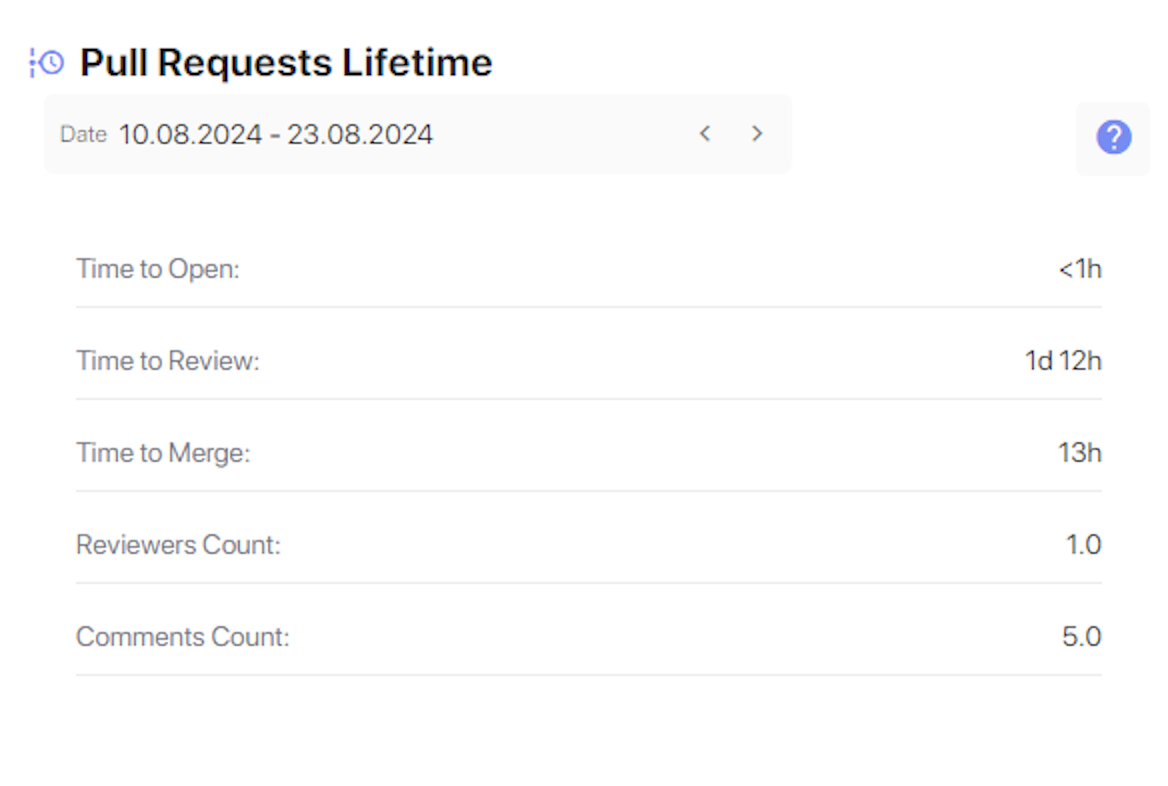
The "Pull Requests Lifetime" widget provides detailed information on the lifetime of a team's PRs and the level of interaction within the team. It calculates average values for five key metrics based on data from all repositories linked to the project. Understanding these metrics helps a team evaluate the efficiency of the PR process and identify how it could be improved.
Key metrics include:
- Date – Select a specific period using this filter. By default, the widget shows data from the last two weeks.
- Time to Open – The average time from the first commit until the PR is opened.
- Time to Review – The average time from when the PR is opened until the first comment from a reviewer.
- Time to Merge – The average time from when the PR is opened until it is merged.
- Reviewers Count – The average number of reviewers per PR.
- Comments Count – The average number of comments on PRs.
Pull Requests Size Distribution
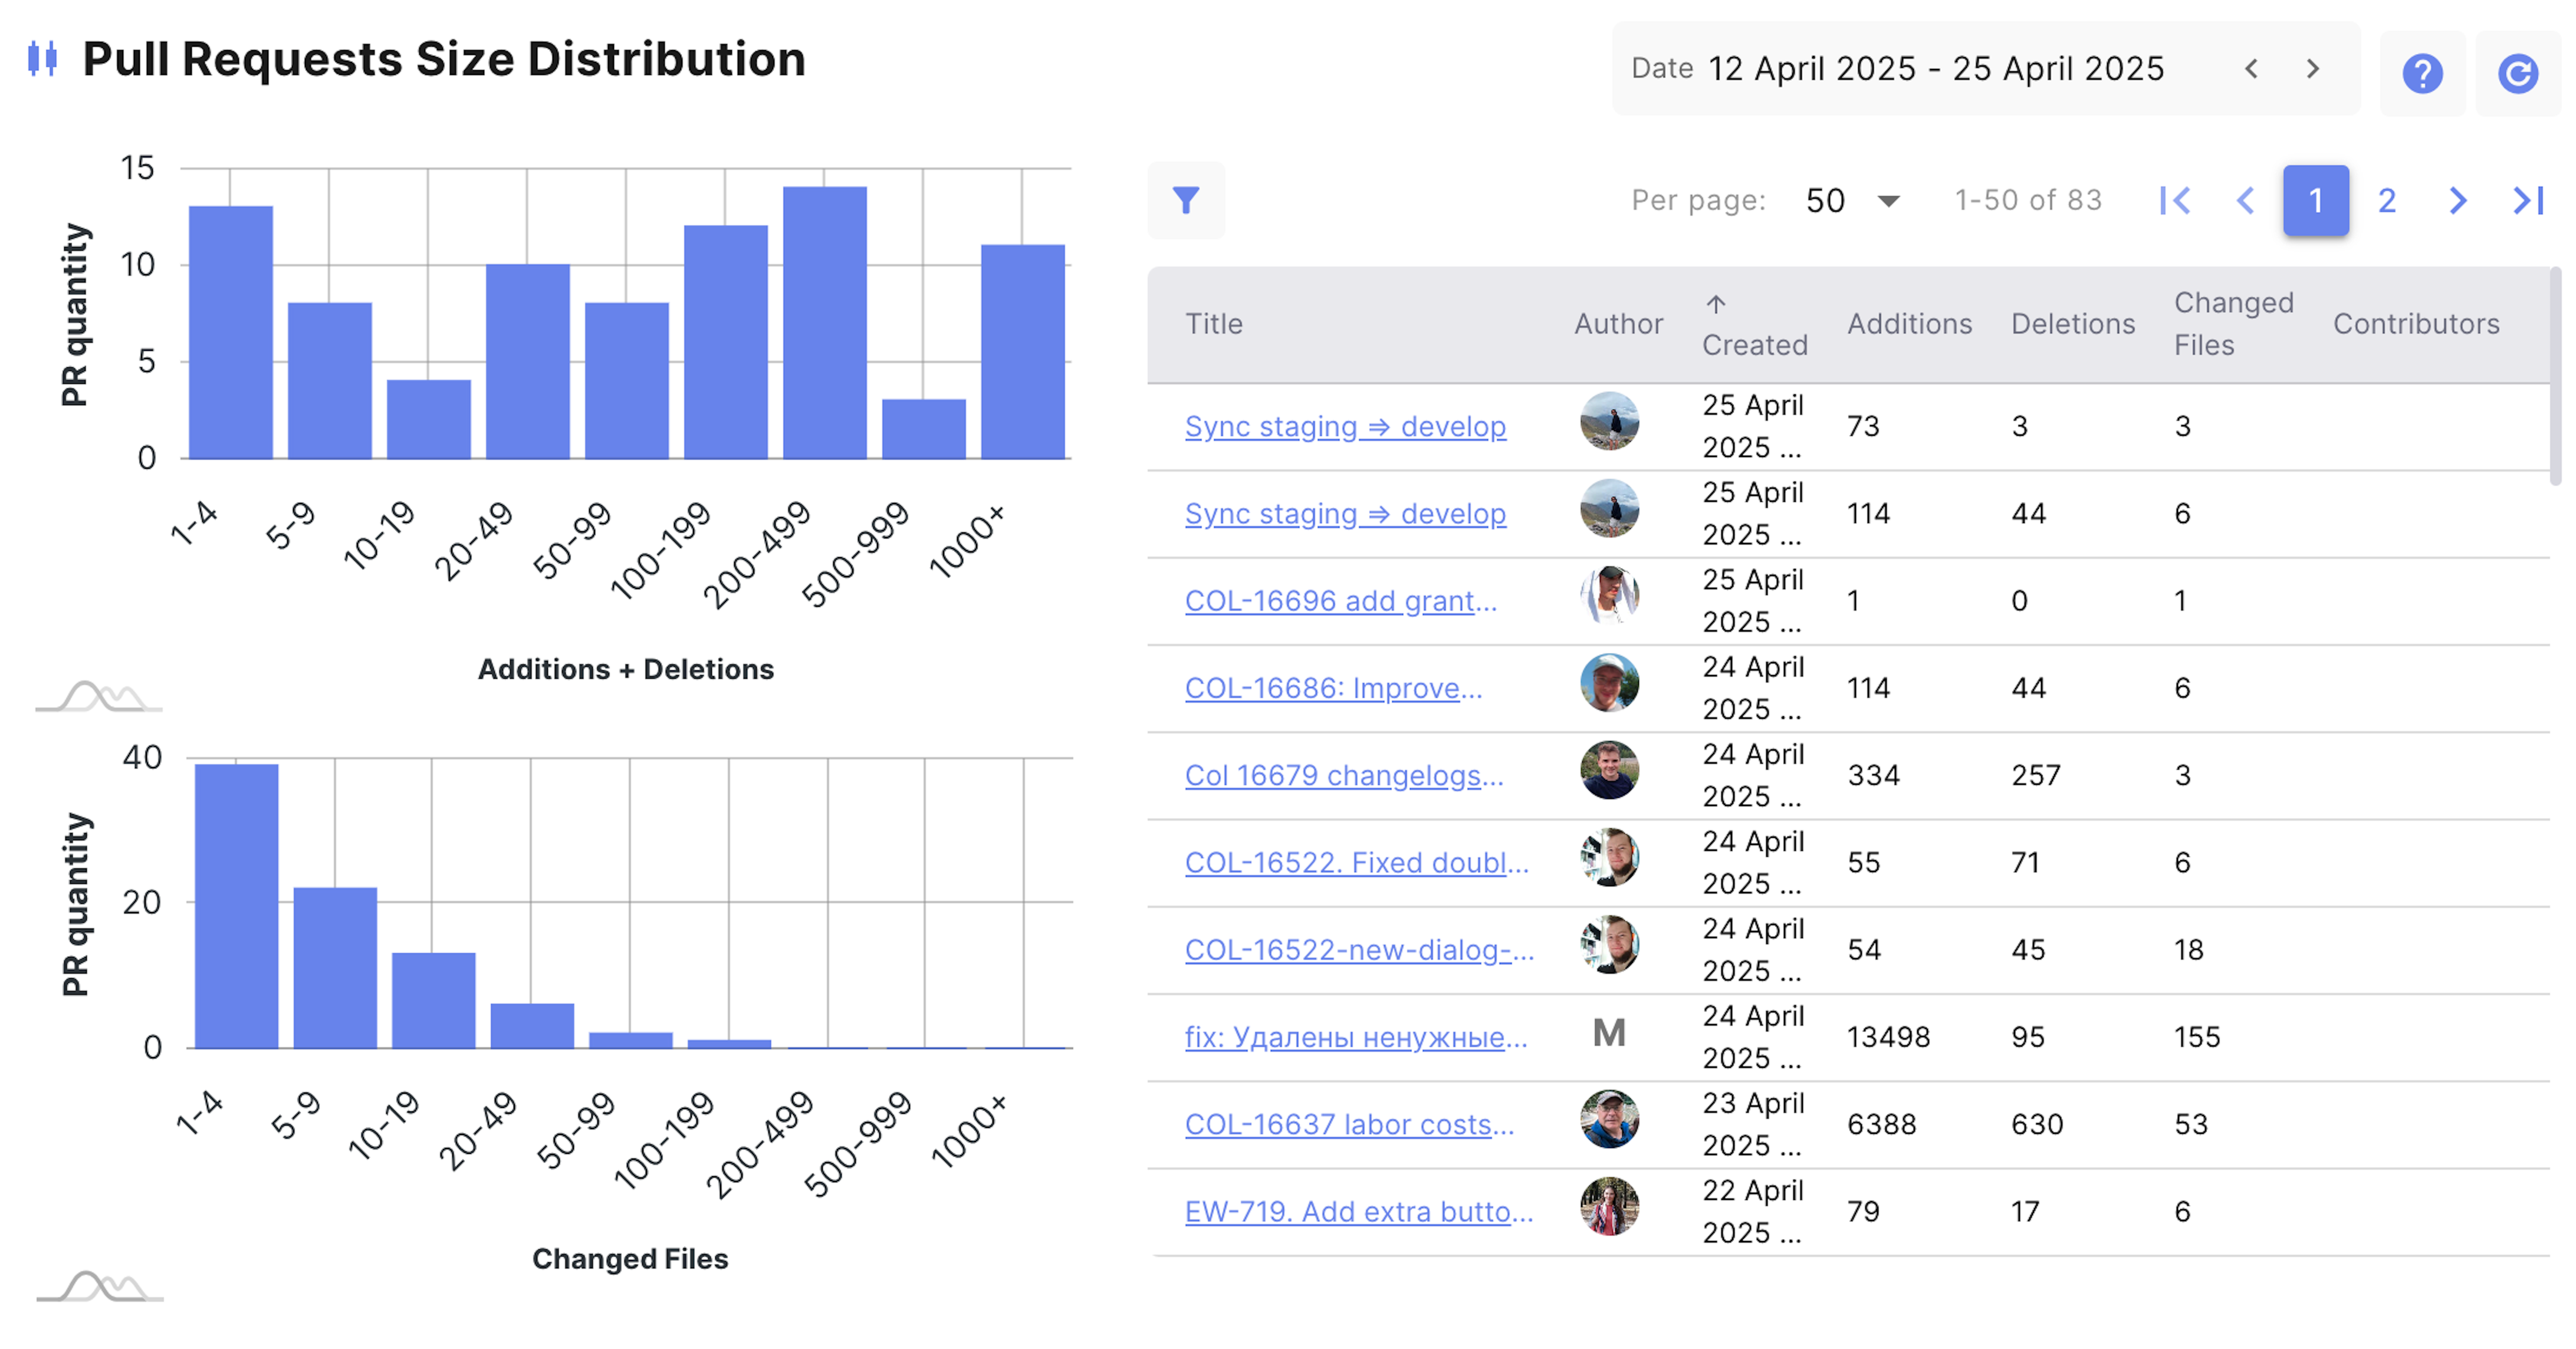
The "Pull Requests Size Distribution" widget provides a detailed overview of a team's PRs and focuses on the scope and impact of the changes made. Enji collects PRs from all repositories linked to a project and then classifies them by the number of additions, deletions, and file changes. This data is used to create bar charts and a detailed table to provide a comprehensive view of the team's work.
Key metrics include:
- Date – Use this filter to select a specific period. By default, the widget shows data from the last two weeks.
- Additions+Deletions Histogram – Shows the distribution of PRs based on the number of code additions and deletions.
- Changed Files Histogram – Displays the distribution of PRs by the number of changed files.
- Table – This table provides detailed data on PRs: PR title (clickable with a link to the PR page), avatars of authors and contributors (clickable with links to their profiles), PR creation date, and the number of additions, deletions, and changed files. Filter the table using the search function in the upper-left corner.
Selecting a bar in the histogram updates the table to show only PRs from that group. To return to the normal view, select the reload button in the top-right corner.
Individual Metrics
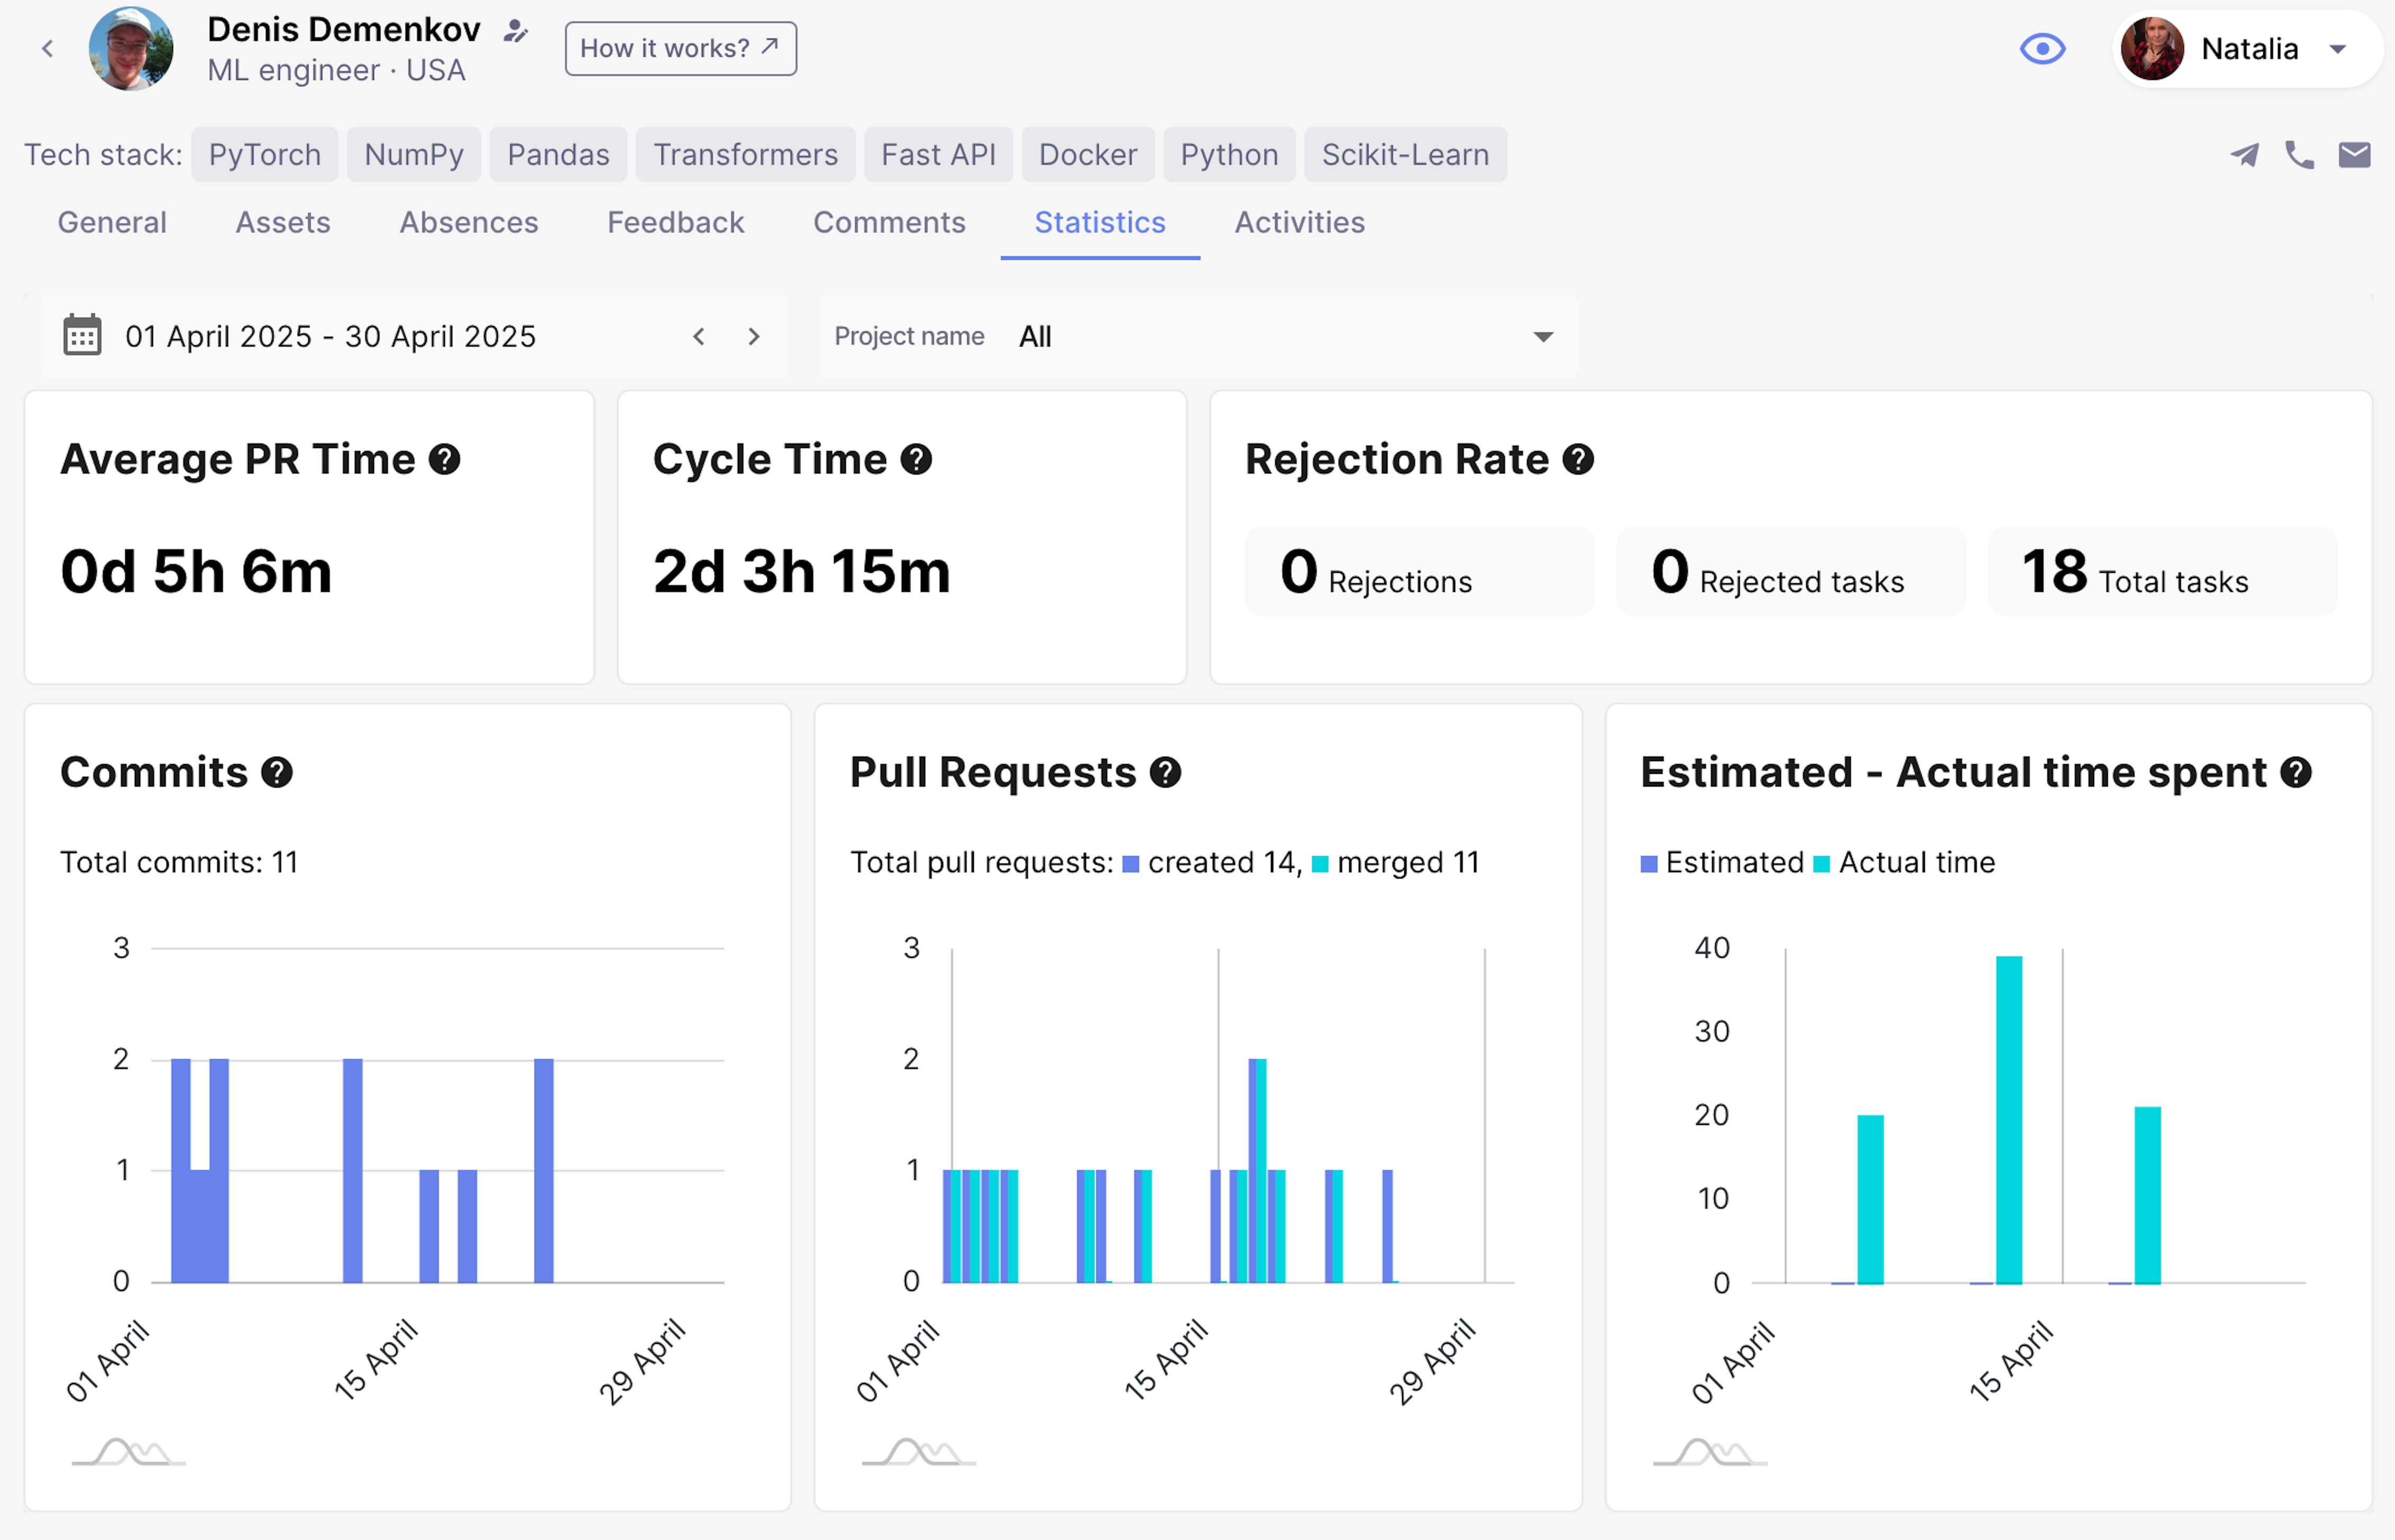
These are averaged indicators for employees across all projects they have worked on during the selected period.
Average PR Time
The average time from creating a merge request (MR) to the merge event.
Cycle Time
The average time taken for a task to move from its initial status (e.g., "To Do") to the final status (e.g., "Done"). Data is collected from all projects the employee has worked on during the selected period. This data only includes projects with the cycle_time metric enabled.
Rejection Rate
This metric shows how often completed tasks are sent back for rework after testing or code review.
- Total Tasks: The total number of tasks a developer has worked on.
- Rejected Tasks: The number of tasks returned for rework.
- Rejections: The total number of times tasks were sent back for rework.
The data is aggregated from all projects the employee worked on during the selected time period. This statistic includes data only from projects where the rejected_tasks metric is configured.
Commits
The number of commits per day.
Pull Requests
The number of PRs created and the number of merges completed per day.
Estimated vs. Actual Time Spent
This statistic compares the time specified in a task's Original Estimate (the task's estimated hours) with the actual time spent to complete it. If more than one task is closed on the same day, the chart will display the sum of Estimated and Actual Time Spent for all tasks on that day.
The data is taken from all projects the employee has worked on during the selected time period. This statistic only includes data from projects where the actual_time_spent metric is configured.
